This calculator lets you quickly convert any raw score into a z-score. The calculator applies the z score formula: Z=(X−μ)/σ
Where:
- x is the raw score
- μ is the mean
- σ is the standard deviation
Thus, to find a standard z score using the calculator, enter the raw score (X), the dataset mean (μ), and the standard deviation (σ). Once you click the Calculate button, you’ll get the z-score instantly. You’ll also find a step-by-step solution section to help you learn how to standardize raw scores manually. The resulting z-score shows how far a value is from the mean in terms of standard deviations, hence; making it easy to compare results across different datasets.
Want to see what this z-score means in terms of probability? Try our Z Score Probability Calculator for instant results.
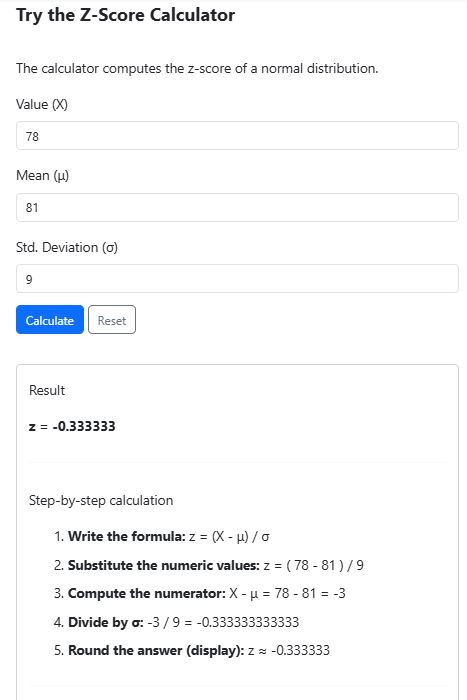
Finding Z Score using the Calculator:Example
Example: A student scored 78 on a math test. The class average was 81 with a standard deviation of 9. Find how this student’s score compares to the rest of the class in terms of standard deviations.
Here, we need to find the standard z score. To do that, follow these steps:
- Enter X = 78 in the calculator.
- Enter Mean (μ) = 81.
- Enter Standard Deviation (σ) = 9.
- Click Calculate.
The calculator will return the z-score as -0.3333 (Figure 1).
Interpreting Z Scores
After calculating the z-score, the next step is to interpret them. Here’s how the z-scores should be interpreted:
- A positive z-score means the value is above the mean.
- A negative z-score means the value is below the mean.
- A z-score of 0 means the value is exactly at the mean.
For instance, the student’s z-score of 1.5 indicates the score is 1.5 standard deviations above the class average.
Want to Learn More About Z Scores? Check out our Z Score Tutorial for step-by-step examples and easy-to-understand explanations. You can also learn how to compute z scores with real excel data using our guide on how to find z scores using excel.
Reference
Z-score in statistics | Engineering mathematics. (2025, July 12). GeeksforGeeks.