When performing a hypothesis test for a sample mean where the population standard deviation is known, or when performing one-proportion or two-proportion z-tests, you will often come across the z test statistic. This test statistic is usually reported as a z-score.
However, the z-score alone does not tell you whether the result is statistically significant. To make that decision, you can either compare the z-score with a z critical value or use it to calculate a p-value. You can then compare the p-value with the significance level (α) to decide whether to reject the null hypothesis or not.
The resulting p-value tells you how likely it is to observe a z-score as extreme as the one obtained, assuming the null hypothesis is true. To find the p-value from a z-score by hand, we use the standard normal table, also known as the z-table.
However, the correct method for finding the p-value from z depends on whether the hypothesis test is left-tailed, right-tailed, or two-tailed. In this article, we will explain how to find the correct p-value from a z-score for each type of test using a z-table.
Want to quickly find the p-value from z without using Tables?
What is a Z-Score in Hypothesis Testing?
In hypothesis testing, a z-score is the test statistic you calculate from the data. For instance, if you’re conducting a hypothesis test for one sample proportion, the test statistic would be . The resulting z value after evaluating the formula above is the z-score, which we use to find the correct p-value for your test.
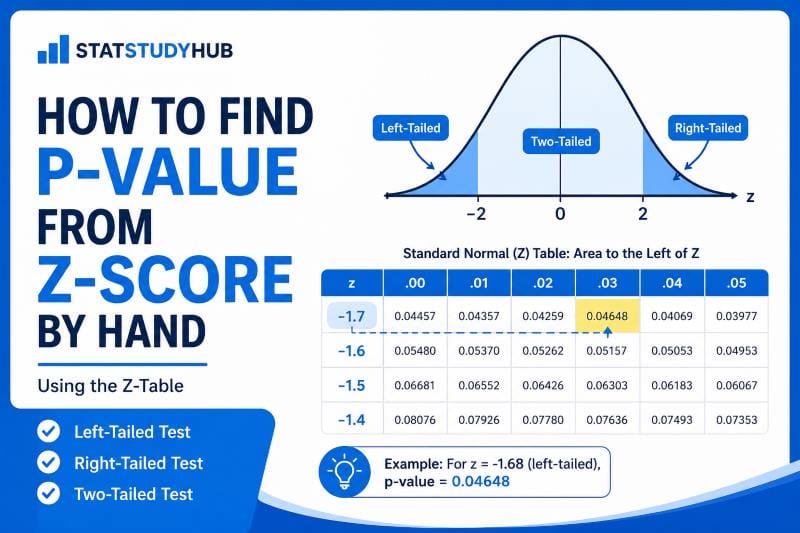
For example, if the test statistic from the formula is z = 1.68, and say you’re conducting a left-tailed test, then you can find the correct p-value for the test by finding the area to the left of z = 1.68 from the z tables.
Finding the P-values from Z Scores using Z tables
Finding the p-value from a z-test statistic is equivalent to finding the area under the standard normal curve, provided you pay attention to the type of test you’re conducting. A simple rule to follow is:
- Find the area to the left of the z-score for a left-tailed test p-value
- Find the area to the right of the z-score for a right-tailed test p-value
- Find the combined area in both tails for a two-tailed test p-value
To help you grasp the concept, let’s go through several examples.
Example 1. Find the P-value for a Left-Tailed Test
Suppose a public health researcher claims that fewer than 60% of adults in a city exercise at least three times per week. To test this claim, a one-proportion z-test is performed, and the resulting z-statistic is -1.68. Find the correct p-value for the test.
Solution
Since the researcher claims that fewer than 60% of adults exercise at least three times per week, the correct hypotheses are:
H0: p = 0.60
H1: p < 0.60
Since the alternative hypothesis uses the “less than” symbol (<), this is a left-tailed test.
Thus, to find the correct p-value for the test, we simply look up the -1.68 value from the negative z table. Therefore, the p-value corresponding to a z-score of -1.68 is 0.04648 (highlighted in yellow).
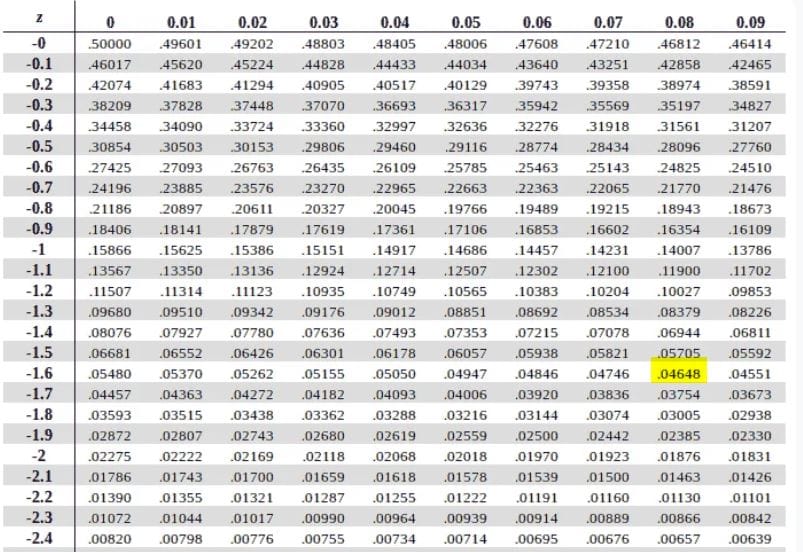
Since the p-value (0.04648) is less than the significance level (0.05), we reject the null hypothesis. Thus, there is sufficient evidence to conclude that fewer than 60% of adults in the city exercise at least three times per week.
Example 2. Find the P-Value for a Right-Tailed Test
Suppose a school administrator claims that the average score on a standardized test is greater than 72. From previous records, the population standard deviation is known to be 10. A sample of students is selected, and a one-sample z-test is performed. The resulting z-statistic is 2.76. Find the correct p-value for the test.
Solution
Since the administrator claims that the average test score is greater than 72, the correct hypotheses are:
H0: μ =72
H1: μ >72
Since the alternative hypothesis uses the “greater than” symbol (>), this is a right-tailed test.
Thus, to find the correct p-value, we first look up the z-score of 2.76 in the positive z-table to get the cumulative area to the left of z = 2.76.
From the z-table, the cumulative probability corresponding to a z-score of 2.76 is: P(Z<2.76) = 0.99711 (highlighted in yellow).
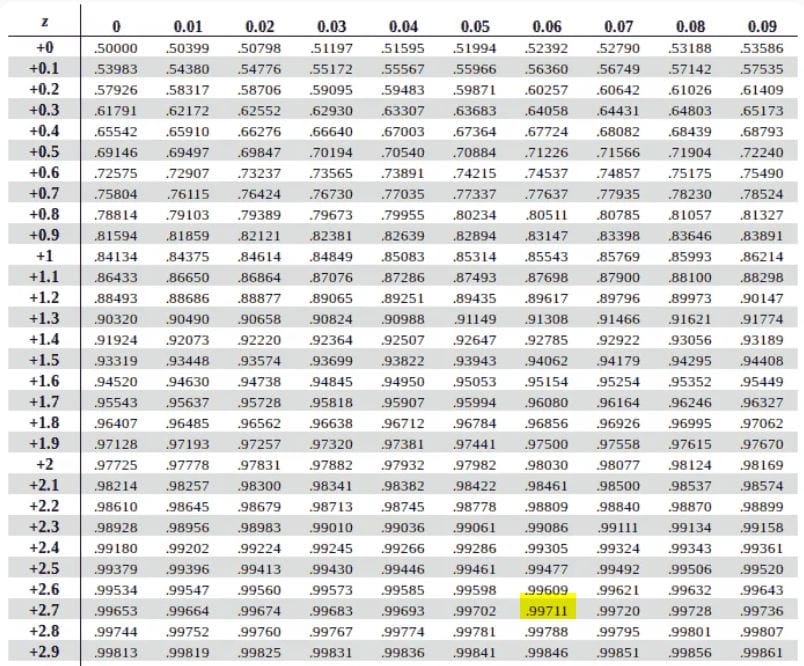
However, this is not the final p-value because most z-tables give the area to the left of the z-score. Since this is a right-tailed test, we need the area to the right of the z-score.
Therefore, the p-value for the right-tailed test is 1-0.99711 = 0.00289
Since the p-value (0.00289) is less than the significance level (0.05), we reject the null hypothesis. Therefore, there is sufficient evidence to conclude that the average standardized test score is greater than 72.
Example 3. Find the P-Value for a Two-Tailed Test
Suppose a researcher wants to test whether the proportion of customers who prefer a new product design differs from the proportion who preferred the old design. In a previous study, 48% of customers preferred the old design. A new sample is collected, and a one-proportion z-test is performed. The resulting z-statistic is 2.10. Find the correct p-value for the test.
Solution
Since the researcher wants to test whether the proportion of customers who prefer the new design is different from 48%, the correct hypotheses are:
H0: p = 0.48,
H1: p ≠ 0.48
Since the alternative hypothesis uses the “not equal to” symbol (≠), this is a two-tailed test.
Thus, to find the correct p-value, we first find the area in one tail and then multiply it by 2.
Since the z-statistic is positive, we can look up z = 2.10 in the positive z-table. From the z-table, the cumulative probability corresponding to z=2.10 is: P(Z<2.10) = 0.98214 (Highlighted in Yellow)
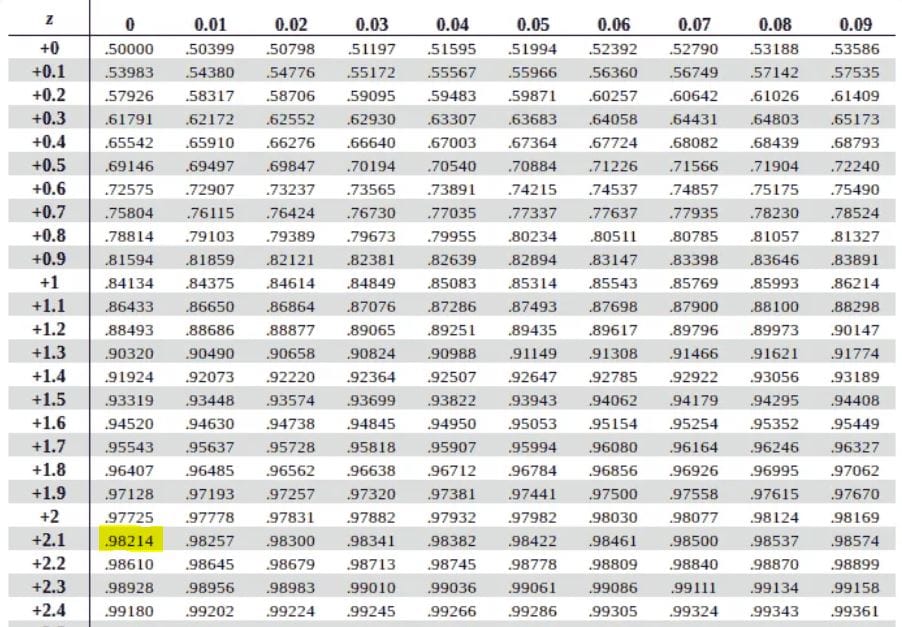
The value 0.98214 is the area to the left of z = 2.10 and not the p-value. So, we first find the area to the right of z = 2.10 by subtracting 0.98214 from 1.
Thus, P (Z > 2.10) = 0.01786
Since this is a two-tailed test, we multiply the one-tailed area by 2. Thus, the correct p-value for the two-tailed test is 2 * 0.01786
= 0.03572
Since the p-value (0.0358) is less than the significance level (0.05), we reject the null hypothesis. Thus, there is sufficient evidence to conclude that the proportion of customers who prefer the new product design is different from 48%.
Want to quickly find the correct p-value for any z-test without using tables? Use our z to p-value calculator to get instant results.
P-Value From Z Score Formulas
Once you know whether the test is left-tailed, right-tailed, or two-tailed, finding the correct p-value from the z tables is easy. You only need to remember that most z-tables give the area to the left of the z-score.
Keeping that concept in mind, you can use these formulas to get the p-values for each test type:
- Left-tailed test. The p-value is the area to the left of the z-score, often denoted as p=Φ(z)
- Right-tailed test: To find the p-value, find the area to the right of the z-score and subtract it from 1. That is, p=1−Φ(z)
- Two-tailed test: To get the two-tailed p-value, find the smaller tail area and then multiply it by 2. That is, p = 2×Φ(−∣z∣)
Here, Φ(z) represents the cumulative area to the left of the z-score in the standard normal distribution.
Common Mistakes When Finding P-Value from Z-Score
Finding a p-value from a z-score is easy once you know the test type. However, students often make these mistakes:
- Using the wrong tail. The same z-score can give different p-values depending on whether the test is left-tailed, right-tailed, or two-tailed. Therefore, you should always check the alternative hypothesis first.
- Forgetting to subtract from 1 in a right-tailed test. Most z-tables give the area to the left of the z-score. As such, for a right-tailed test, the p-value is the area to the right. Thus, p=1−Φ(z)
- Forgetting to multiply by 2 in a two-tailed test. A two-tailed test includes both tails. Thus, you should always multiply the one-tailed area by 2 to get the correct p-value. That is, p = 2 × one-tail area
- Using the wrong sign in a two-tailed test. For a two-tailed test, use the absolute value of the z-score. For example, z=2.10 and z=−2.10 have the same two-tailed p-value.
- Reading the wrong row or column in the z-table. A z-score such as 1.43 is found by using row 1.4 and column 0.03. A small table-reading mistake can change the final p-value.