A Z Score Table, also called a Standard Normal Table, shows the probability of a value occurring below a specific z-score in a standard normal distribution. It helps you find the area under the bell-shaped curve for any given z value. The table lists z-scores along the rows and columns, and at their intersection, you can see the corresponding probability. This makes it easy to convert a z-score into a percentage or probability without complex calculations. In this guide, you’ll learn what the z score table is, how to read it, and how to use both positive and negative z tables with simple examples.
What is a Z Score Table?
A Z Score Table, also known as a Standard Normal Table, lists the cumulative probability linked to each z-score in a standard normal distribution, where the mean is 0 and the standard deviation is 1. It shows how much of the data lies below a certain z-score, making it easy to find probabilities without doing complex math or integration. A z-score itself tells you how many standard deviations a value is from the mean. By using the z score table, you can quickly find the probability or area under the curve for any value in a normal distribution.
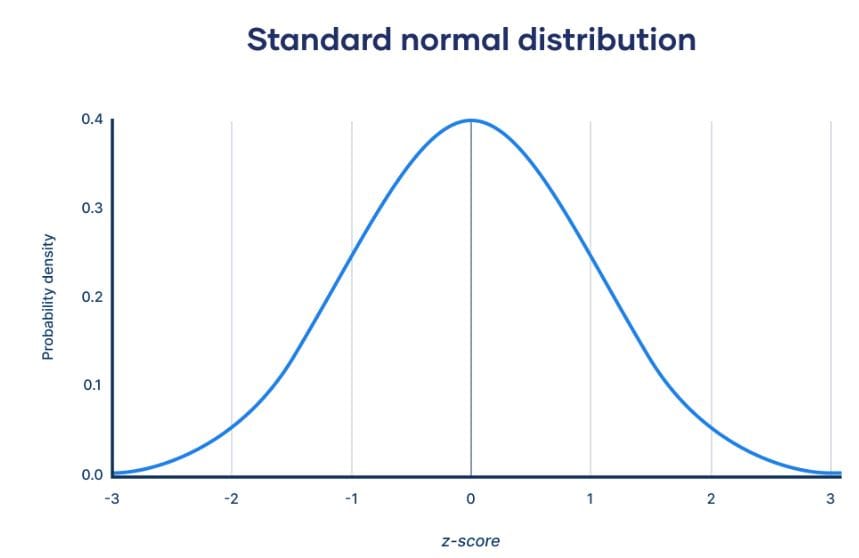
There are two main types of Z Score Tables: positive and negative. The positive z table lists probabilities for z-scores above the mean (right side of the curve). On the other hand, the negative z table lists probabilities for z-scores below the mean (left side of the curve). Since the standard normal distribution is symmetric (Figure 1), the negative table is a mirror image of the positive one. Using both tables, you can easily find probabilities for any z-score value, whether it lies to the left or right of the mean.
Positive Standard Normal Table (Right Side of the Mean)
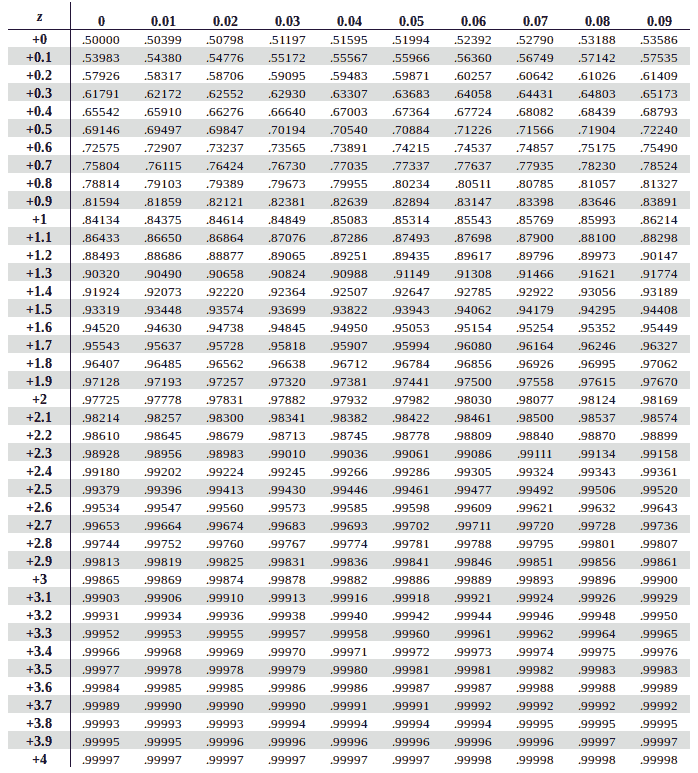
As shown in Table 1 below, the positive standard normal table lists probabilities for z-scores greater than zero, which lie on the right side of the mean. These values lie on the right side of the mean in the standard normal distribution. Each cell in the table represents the area under the curve to the left of a given positive z-score.
In the table, the rows show the first digit and the first decimal place of the z-score (for example, 1.6), while the columns show the second decimal place (for example, 0.05). To find a probability, you match the row and column that correspond to your z value.
For example, to find P(Z<1.65), follow these steps:
- Go to the row for 1.6
- Move across to the column for 0.05
- The intersection gives 0.9505
So, the probability that Z is less than 1.65 is 0.9505 (or 95.05%).
Negative Standard Normal Table (Left Side of the Mean)
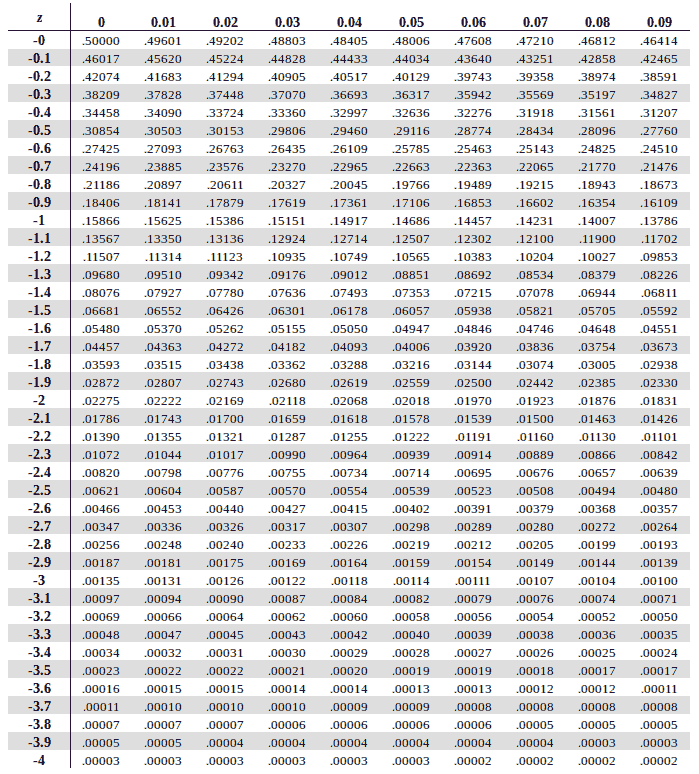
A Negative Standard Normal Table shows the cumulative probabilities for z-scores less than zero (See Table 2). These values lie on the left side of the mean in the standard normal distribution. Notably, each entry represents the area under the curve to the left of a given negative z-score. Thus, the rows show the first digit and first decimal place of the z-score (for example, -1.2), while the columns show the second decimal place (for example, 0.03).
Because the normal distribution is symmetric, probabilities on the left side mirror those on the right side. This means P(Z<−α)=1−P(Z<α). For example, as shown in the table, to find P(Z<−1.23), we can either use a negative z table and follow these steps:
- Go to the row for -1.2
- Move to the column for 0.03
- The intersection gives 0.1093
Thus, the probability that Z is less than -1.23 is 0.1093 (or 10.93%).
Alternatively, you can use the positive z score table and apply the same formula. For instance, P(Z<−1.23)=1−P(Z<1.23). From the positive z table, P(Z<1.23)=0.8907. Therefore, P(Z<−1.23)=1−0.8907=0.1093. This means you can find probabilities for negative z-scores using the positive table if a negative one is not available.
Want a handy offline version of both positive and negative Z Score Tables? Click below to download the full Standard Normal Distribution Table (PDF) for quick reference and study use.
How to Find Probability From a Z Table (Step-by-Step)
Reading a Z Score Table is simple once you understand how it is organized. Each z-score is split into two parts: the first two digits and the second decimal place. The rows of the table show the first digit and the first decimal of the z-score, while the columns show the second decimal place. To find the probability from z table, follow these three easy steps:
- Identify the row that contains the first digit and first decimal of your z-score.
- Identify the column that matches the second decimal of your z-score.
- Read the intersection of the row and column to find the cumulative probability (the area to the left of that z-score).
Example 1: Find Probability from a Positive Z Score
Find P(Z<1.65).
- Step 1: Go to the row for 1.6.
- Step 2: Move across to the column for 0.05.
- Step 3: The intersection gives 0.9505.
Therefore, the probability that Z is less than 1.65 is 0.9505, or 95.05%.
If you prefer quick results, you can use our free Z Probability Calculator to instantly find probabilities from any z-score. The calculator provides accurate results with a visualization to show you the area under the curve.
How to Find a Z Score from a Given Probability (Step-by-Step)
Sometimes, instead of finding a probability from a z-score, you may want to find the z-score itself that corresponds to a given probability or confidence level. This z-score is often called the z critical value, and it plays a key role in hypothesis testing and confidence interval estimation.
To find the z critical value manually, you can use the z table by following these steps:
- Locate the probability (area) closest to your desired value inside the z table.
- Identify the corresponding row and column for that probability.
- Combine the row and column values to get the z-score.
For instance, suppose you want to find the z-score that corresponds to a cumulative probability of 0.9750. You can easily find the z score by following these steps:
- Step 1: In the z table, look for the value 0.9750 (or the closest value to it).
- Step 2: You’ll find this value at the intersection of row 1.9 and column 0.06.
- Step 3: Combine these values to get z = 1.96.
Therefore, P(Z<1.96)=0.9750. This z-score (1.96) is the critical value for a 95% confidence level. In other words, 95% of the area lies to the left of it.
If you want to skip manual lookup, try our Z Critical Value Calculator. It instantly gives you the critical z value for any confidence level. You can also check out our detailed guide on how to find z critical values using z tables for a more step-by-step explanation with visual examples.
Want to Master Reading Z Tables? Understanding how to read the Standard Normal Table is essential for interpreting probabilities correctly. Check out our Comprehensive Guide on How to Read the Z Table — complete with visuals, step-by-step examples, and tips to avoid common mistakes.
Frequently Asked Questions
A Z Score Table is used to find the probability (area) under the standard normal curve for a given z-score. It helps you determine how likely a value is to occur in a normal distribution without doing complex calculations.
To find a probability, locate the z-score’s first two digits in the table’s rows and the second decimal in the columns. The value where they meet is the probability to the left of that z-score.
A positive Z Score Table shows probabilities for values above the mean, while a negative Z Score Table shows probabilities for values below the mean. Because the normal curve is symmetric, you can use a positive z table for negative values by applying the formula: P(Z < -α) = 1 – P(Z < α).
To find the z-score for a given probability, look inside the table for the probability value closest to your target. Then, combine the row and column headings to get the z-score. You can also use our Z Critical Value Calculator for a faster result.
Yes. The z table gives the left-tail probability by default. For a right-tail test, simply subtract the table value from 1. For example, if P(Z < 1.65) = 0.9505, then P(Z > 1.65) = 1 – 0.9505 = 0.0495.