Use our Z Critical Value Calculator to quickly find one-tailed and two-tailed Z critical values for any significance level (α). This tool saves you time by instantly computing the critical value without relying on Z tables. It is perfect for students, researchers, and anyone performing hypothesis testing or calculating confidence intervals.
What is Z Critical Value?
A Z critical value is the point on the standard normal curve that marks the boundary between the rejection and acceptance regions in a hypothesis test. It shows the threshold beyond which results are statistically significant. It is also used to calculate the margin of error when determining confidence intervals for a population mean or proportion.
How to Use the Z Critical Value Calculator
Using our calculator is quick and simple. Follow these steps to get your Z critical value:
- Enter the significance level (α): This is usually 0.05 for a 95% confidence level.
- Select the type of test: Choose one-tailed or two-tailed depending on your hypothesis.
- Click “Calculate”: The calculator will instantly show the Z critical value.
- View step-by-step explanation: The calculator also shows how the value was determined.
For example: If you enter α = 0.05 and select a two-tailed test, the calculator will show Z = ±1.96. This value indicates the cutoff points beyond which your test statistic would be considered statistically significant.
Quick Example: Finding Z Critical Value Using the Calculator
This section shows how to apply the Z Critical Value Calculator in both hypothesis testing and confidence interval calculation. Each example demonstrates how the calculator helps you make decisions and interpret results.
Two-Tailed Hypothesis Test Example
A school implements a new teaching method and wants to see if it changes student exam scores. The teacher calculates Z test statistic = 1.90. At a 5% significance level, can we conclude that the new method changes exam scores? (Use the critical value approach.)
Solution
- State the Hypotheses
- Null hypothesis (H₀): μ = current exam mean
- Alternative hypothesis (H₁): μ ≠ current exam mean
- Identify the Type of Test: This is a two-tailed test with α = 0.05
- Identify the Z test statistic: From the scenario, the z statistic = 1.90
- Find Z Critical Value: Using the calculator, the Z-critical values are ±1.96 (see Figure 1)
- Decision Rule: If Z test statistic < -1.96 or > 1.96, we should reject H₀. Otherwisem we fail to reject H₀
- Compare Z Statistic with Critical Value: Since the z test statistic (1.90) is within ±1.96, we fail to reject H₀
- Conclusion: There is not enough evidence to say the new teaching method changes exam scores.

Right-Tailed Hypothesis Test Example
A tutoring program wants to see if it increases student math scores. The computed Z test statistic = 3.0. At 5% significance level, can we conclude the program improves scores?
Solution
- State the Hypotheses
- H₀: μ ≤ current mean score
- H₁: μ > current mean score
- Identify the Significance Level (α) and Type of Test: This is a right-tailed test (one-sided) with α = 0.05
- Identify the z test statistic: z test statistic = 3.0
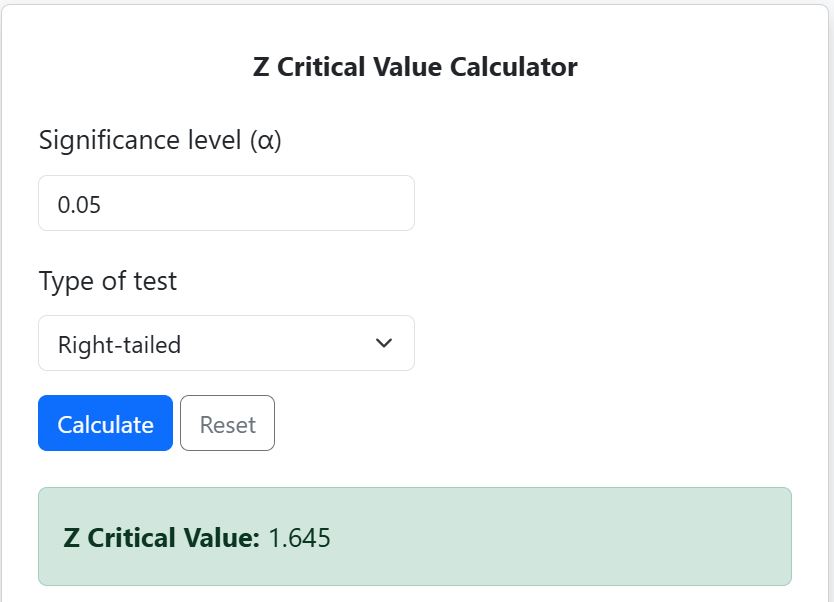
- Find Z Critical Value: Using the calculator, the z-critical value is 1.645 (See Figure 2)
- Decision Rule: If Z > 1.645, we reject H₀. Otherwise, we fail to reject H₀
- Compare Z Statistic with Critical Value: Since the z test statistic (Z = 3.0) is greater than z-critical value (1.645), we reject H₀
- Conclusion. The tutoring program significantly increases scores at 5% significance.
Left-Tailed Hypothesis Test Example
A nutritionist tests whether a new diet reduces cholesterol. The computed Z test statistic = -3.125. At 5% significance level, can we conclude the diet lowers cholesterol?
Solution
- State the Hypotheses
- H₀: μ ≥ population mean cholesterol
- H₁: μ < population mean cholesterol
- Identify the type of test and Significance Level (α): This is a one-sided (left-tailed) test. α = 0.05
- Identify the Z test statistic: From the scenario, the z test statistic is -3.125
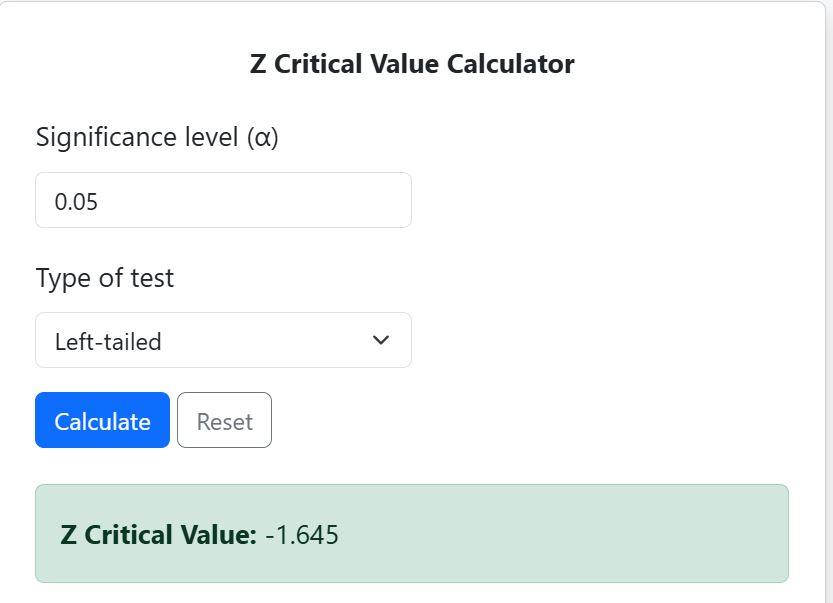
- Find Z Critical Value: Using the calculator, the z critical value is -1.645 (see Figure 3).
- Decision Rule: If Z < -1.645, we reject H₀. Else, we fail to reject H₀
- Compare Z Statistic with Critical Value: Since the z-test statistic (-3.125) is less than the critical value (-1.645), we Reject H₀
- Conclusion: The diet significantly lowers cholesterol at the 5% level.
Confidence Interval Example
A researcher wants to estimate the average height of students at a university. A sample of 50 students has mean = 170 cm and population standard deviation = 6 cm. Construct a 95% confidence interval using Z critical values.
Solution
- Identify Confidence Level: 95% → α = 0.05
- Type of Test: Two-tailed (for confidence interval)
- Find Z Critical Value: Use the calculator to find two-tailed critial value when α = 0.05. This gives Z critical value = ±1.96 (See Figure 1).
- Compute Margin of Error (ME): $ME = Z_{\text{crit}} \times \frac{\sigma}{\sqrt{n}}$
- $ = 1.96 \times \frac{6}{\sqrt{50}}$
- $ \approx 1.66$
- Construct Confidence Interval: $CI = \bar{X} \pm ME$
- $ = 170 \pm 1.66$
- = [168.34, 171.66]
- Interpretation: We are 95% confident that the true mean height lies between 168.34 cm and 171.66 cm.
Want to Learn How to Compute Z Critical Values Manually? Check out our detailed guide on how to Compute Z Critical Values by Hand. The article shows you exactly how to find one-tailed and two-tailed Z critical values without a calculator but using z-tables.
Z Critical Values for Common Significance Levels
While the calculator can give you exact results for any alpha level, it is also helpful to have a quick reference. The table below shows the most widely used one-tailed and two-tailed z critical values at common significance levels.
| Significance Level (α) | Confidence Level | One-Tailed Z Critical Value | Two-Tailed Z Critical Value |
|---|---|---|---|
| 0.10 | 90% | 1.282 | ±1.645 |
| 0.05 | 95% | 1.645 | ±1.960 |
| 0.025 | 97.5% | 1.960 | ±2.241 |
| 0.01 | 99% | 2.326 | ±2.576 |
| 0.005 | 99.5% | 2.576 | ±2.807 |
| 0.001 | 99.9% | 3.090 | ±3.291 |
Tips for Using Our Z-Critical Value calculator
- Always select the correct test type: one-tailed (right or left) or two-tailed.
- Enter a valid significance level (α) between 0 and 1.
- Use the calculator to quickly verify Z critical values when solving homework, assignments, or research problems.
- For full understanding, practice computing Z critical values manually using standard normal tables alongside the calculator.
Want to learn how to calculate Z critical values in Excel step by step using NORM.S.INV(), with examples for left-tail, right-tail, and two-tailed tests? Check out our full guide here.
Frequently Asked Questions
A Z critical value is the point on the standard normal distribution that separates the rejection region from the acceptance region in hypothesis testing. It helps determine whether results are statistically significant and is also used in calculating confidence intervals.
The calculator uses the inverse of the cumulative standard normal distribution. Enter your significance level (α) and select one-tailed or two-tailed test. It instantly computes the corresponding Z critical value and provides a step-by-step explanation.
Use a one-tailed test when the alternative hypothesis predicts a specific direction (increase or decrease). Use a two-tailed test when the alternative hypothesis only tests for a difference, without specifying the direction.
Yes. For confidence intervals, the calculator provides the Z critical value for the desired confidence level, which can then be used to calculate the margin of error around the sample mean.
You can enter any value between 0 and 1. Common choices are 0.05 (95% confidence), 0.01 (99% confidence), and 0.10 (90% confidence), but the calculator works for custom levels as well.
A Z score shows how far a specific data point is from the mean in standard deviations. A Z critical value is the threshold used in hypothesis testing or confidence intervals to determine statistical significance.