
In statistics, a z-score is a standard score that indicates how many standard deviations a data point is from the mean. For instance, a z value of -2 means that the data point is 2 standard deviations below the mean.
To find the z-score value manually, we use the following formula:
z=(x−μ)/σ
Where
- z is the z-score (standard score)
- x is the raw data point
- μ is the mean
- σ is the standard deviation
Besides applying the formula manually, you can also use a single z-score value calculator, especially when you want to convert a single data point to a standard score. However, for a set of data values, calculating all the z scores manually can be tiresome. In this case, you need to use technology such as Excel, R, SPSS, etc. In this article, we’ll walk you through how to find z-score values using Excel.
How to Calculate Z-Score Using Excel
Finding z-score values in Excel is easy and quick. You can either find the value manually by applying the z-score formula or using the STANDARDIZE function. Each of these methods is discussed below:
Manual Formula Approach
To calculate the z-score in Excel using the z-score formula, follow these steps:
- Calculate the mean of the dataset. To find the mean of the dataset in Excel, you simply type the formula
=AVERAGE(YourDataRange)in an empty cell and click Enter. Check out the comprehensive guide on computing the sample mean in Excel for more details. - Calculate Standard Deviation. To calculate the standard deviation in Excel, type the formula
=STDEV.S(YourDataRange)(for sample data) or=STDEV.P(YourDataRange)(for population data) and click the Enter key. - Apply the Z-score formula. In a new column next to your data, use
=(B2 - $MeanCell) / $StdDevCell. ReplaceB2with your first data point, andMeanCell/StdDevCellwith the cells containing your calculated mean and standard deviation. Note. You should add a dollar sign after clicking the cells with your mean and standard deviation to lock them. - Fill Down: Double-click the small square (fill handle) at the bottom-right of the formula cell to apply it to all your data points.
By clearly following the 4 steps, you’ll find z-score values for both sample and population data. To help you grasp the concepts, let’s walk you through an example.
Example 1. Finding Z-Score in Excel using Manual Formula Method
To clearly understand how to use the manual formula approach to calculate z-scores in Excel, consider the following data consisting of marks scored by 10 students in a math exam.
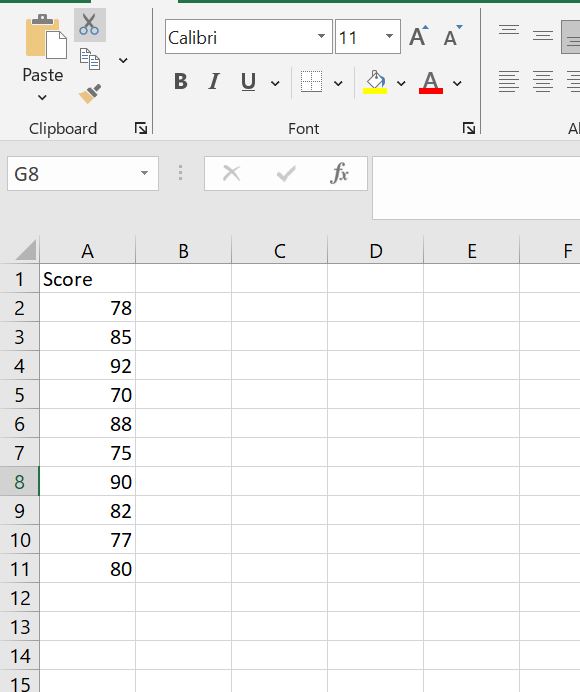
Step 1: Enter the data in cells A2:A11 as shown below
Step 2: Calculate the Mean of the Dataset.
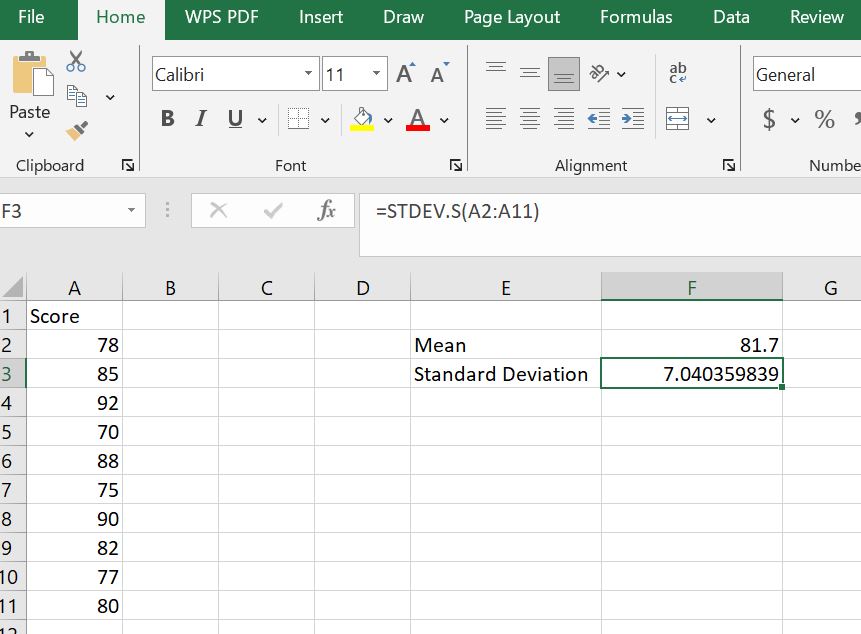
To find the mean of the data, type the formula =AVERAGE(A2:A11) in cell F2 and press Enter. You can also label the result as “Mean” in cell E2 as follows:

Note. A2:A11 refers to the cells containing your data. You can simply select the cells containing the data directly instead of typing the range.
Step 3: Find the Standard Deviation of the Dataset
In this case, we’re assuming that the data is from a sample (not population data). Thus, we’ll use the sample standard deviation function, =STDEV.S().
To find the sample standard deviation, type the formula: =STDEV.S(A2:A11) in cell F3 and press Enter. You can label it in cell E3 as “standard deviation” as shown below:
Step 4: Apply the Z-Score Formula
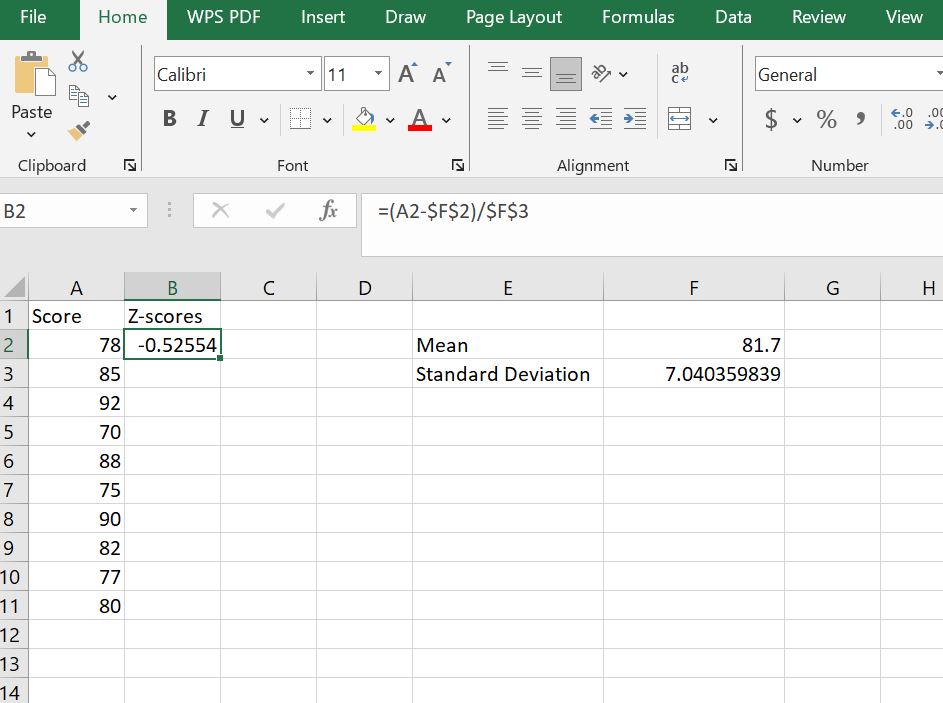
Now, we want to store the z-score values in the second column in Excel and name this column Z-Scores. To do this, in cell B2, you need to apply the z-score formula by subtracting the mean from each score and dividing by the sample standard deviation. Thus, we will type the formula; =(A2 - $F$2)/$F$3 in cell B2 and press the enter to see the z-score for the first observation. This will give you a z-score of -0.5255 for the student who score 78 in the exam.
In the formula =(A2 - $F$2)/$F$3:
- A2 is the cell containing the first student’s score
- F2 is the cell containing the mean of the sample
- F3 is the cell containing the sample standard deviation
Note: The dollar sign $ in $F$2 and $F$3 makes the cell reference absolute, meaning that when you copy the formula down the column, Excel will always refer to these specific cells for the mean and standard deviation instead of adjusting the references automatically. Without the $, the references would shift as you copy the formula, giving incorrect results.
Step 4: Copy the Formula for All Students
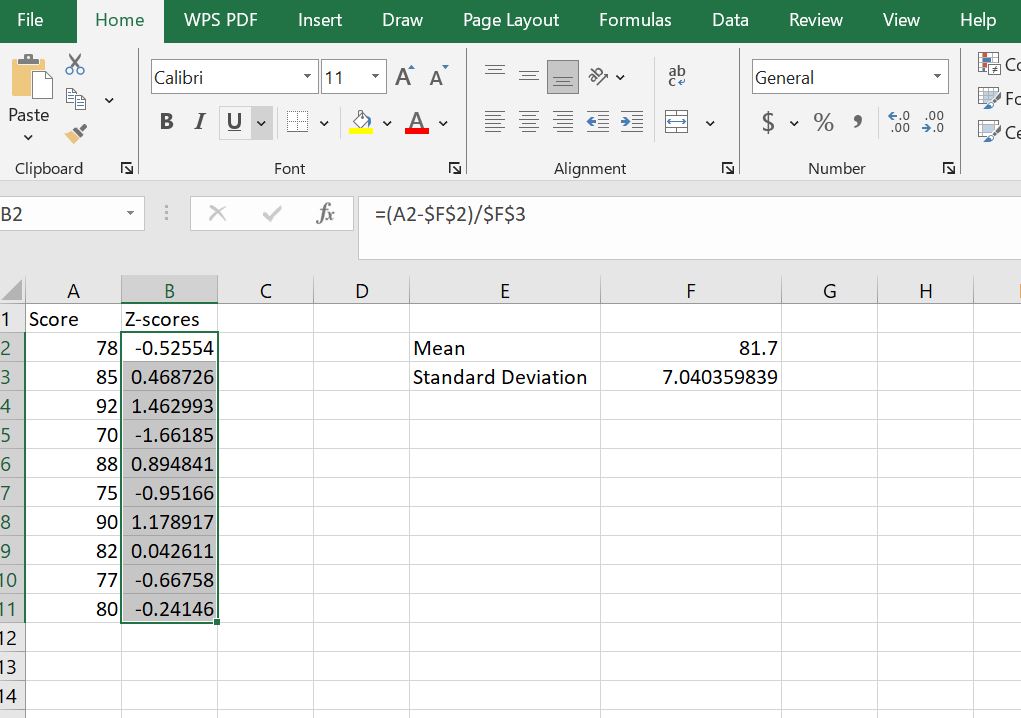
Drag the fill handle (the small square at the bottom-right of the cell) down to calculate z-scores for all students. Each cell now shows how far a student’s score deviates from the mean in standard deviation units.
Method 2. Calculate Z-Score Using the STANDARDIZE() Function
The second and quicker way to calculate z-scores in Excel is by using the built-in STANDARDIZE() function. Normally, the first steps would involve calculating the mean and standard deviation, just like in Method 1. However, since we’ve already computed those values in cells F2 (mean) and F3 (standard deviation), we can skip straight to applying the function.
Step 1: Set Up the Z-Score Column
Create a new column next to your scores to store the standardized results. In cell C1, type Z_Scores to store the results from the STANDARDIZE() function.

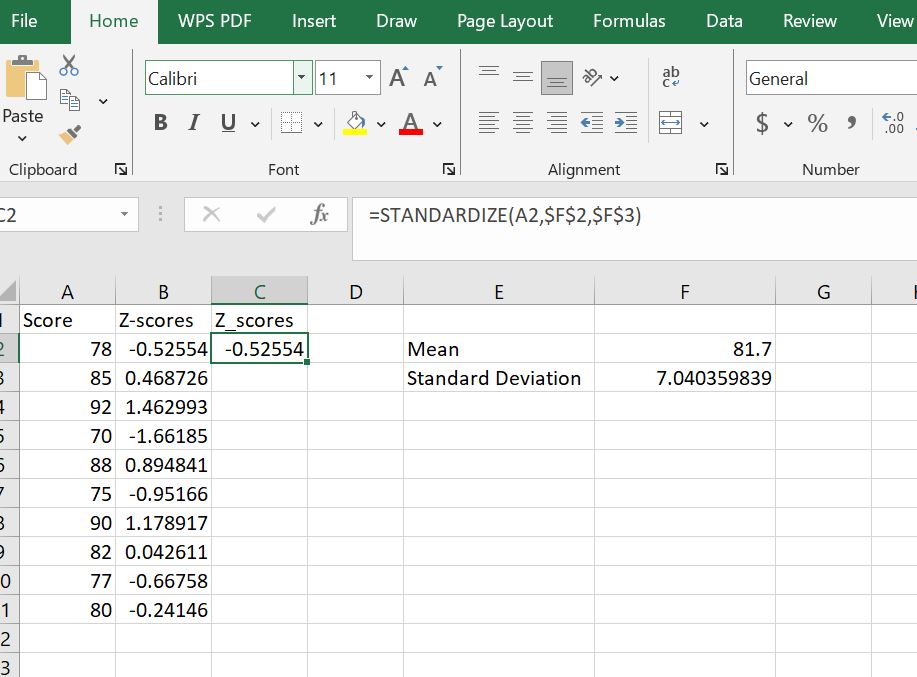
Step 2: Apply the STANDARDIZE Function
In cell C2, type the formula: =STANDARDIZE(A2, $F$2, $F$3) and press Enter to calculate the z-score for the first student. As you can see, the standardize formula gives similar results of z = -0.5255 (for a student with a score of 78) as applying the formula, manually.
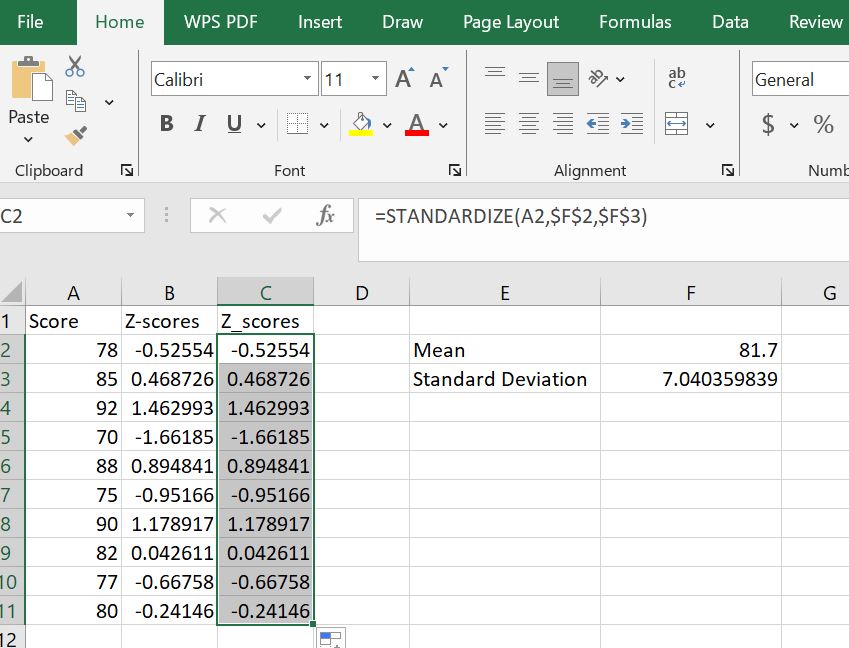
Step 3: Copy the Formula for All Students
Drag the fill handle from C2 down to C11 to apply the formula to all students. You’ll notice that the z-scores in this column match exactly with the ones calculated manually in Method 1.
Conclusion
Calculating z-scores in Excel doesn’t have to be complicated. Whether you choose to apply the formula manually or use the STANDARDIZE() function, both methods give accurate results and help you understand how far each value deviates from the mean. Method 1 is great for learning the underlying math, while Method 2 is faster and ideal for larger datasets. If you want an even quicker option, you can try our free Z-Score Calculator to compute z-scores instantly without opening Excel.
Frequently Asked Questions
The formula to find a Z score in Excel is =(X - Mean)/Standard_Deviation. You can also use Excel’s built-in function =STANDARDIZE(X, Mean, Standard_dev) to get the same result automatically.
To calculate a Z score with STANDARDIZE, enter the formula =STANDARDIZE(A2, $F$2, $BF3) where A2 is your data point, B2 is the mean, and B3 is the standard deviation. This function gives the same output as the manual formula (X - μ) / σ.
A positive Z score means the value is above the mean, a negative Z score means it is below the mean, and a Z score of 0 means the value is exactly equal to the mean.