In statistics, a z-score shows how many standard deviations a value lies from the mean. It helps identify whether a score is above or below average. Understanding how to find probability from a z-score is essential because it reveals how likely a value is to occur within a standard normal distribution. This concept is widely used in hypothesis testing, research, and quality control. For instance, you might calculate the probability that a student scores above a certain SAT mark. In this article, you’ll learn how to find probability from a z-score using the z-tables (Positive and Negative z tables). The article also provides clear examples to help you grasp the concept.
What is a Z Score?
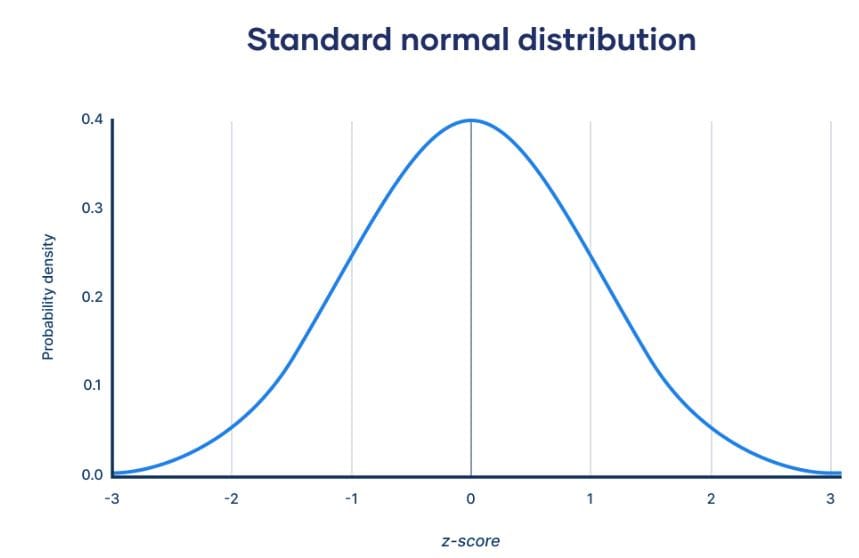
A z-score tells you how many standard deviations a data point is from the mean in a normal distribution (Figure 1). It shows how far and in which direction a value deviates from the average. The formula for calculating a z-score is:
z=(X−μ)/σ
Where: X is the data point, μ is the mean, and σ is the standard deviation.
Struggling with calculating z score values for any data point? Use our free Z Score Calculator to automatically standardize your data point before checking its probability from the z-table.
Relationship Between Z Table and Probability
The z-table, also known as the standard normal table, shows the relationship between z-scores and probabilities in a normal distribution. It tells us how likely it is for a value to fall below, above, or between certain z-scores. Thus, each number in the table represents the area under the curve, which is another way of expressing probability.
To interpret z-probability correctly, you need to understand the different parts of the curve. The left-tail probability shows the area to the left of a z-score, while the right-tail probability shows the area to the right. When finding the probability between two z-scores, you subtract the smaller area from the larger one.
Recall: All probabilities range from 0 to 1.
Steps to Find Probability from a Z Score Using the Z Table
When finding probabilities from z-scores, it is important to know which part of the standard normal distribution you are working with. There are two main types of z-tables: Positive z-table and negative z-table. Each table shows the area under the normal curve, which represents the probability associated with a specific z-score. Therefore, to find any probability from a z score using the standard normal tables, you need to follow these simple steps for each case:
Case 1: Positive Z Tables (table that list positive z values only)
To find the probability corresponding to a given z score using positive z tables, you should follow this procedure:
- Find the row showing the first two digits of the z-score (for example, 1.2)
- Find the column showing the second decimal place (for example, 0.03).
- Locate the intersection between the row value and the column value. The value where the row and column meet gives the area under the curve for that z-score.
Note. If you are required to compute the left probability, P(Z<a), you should use the value as it is. However, if you need to find the right-tailed probability, the correct value is 1-P(Z<a).
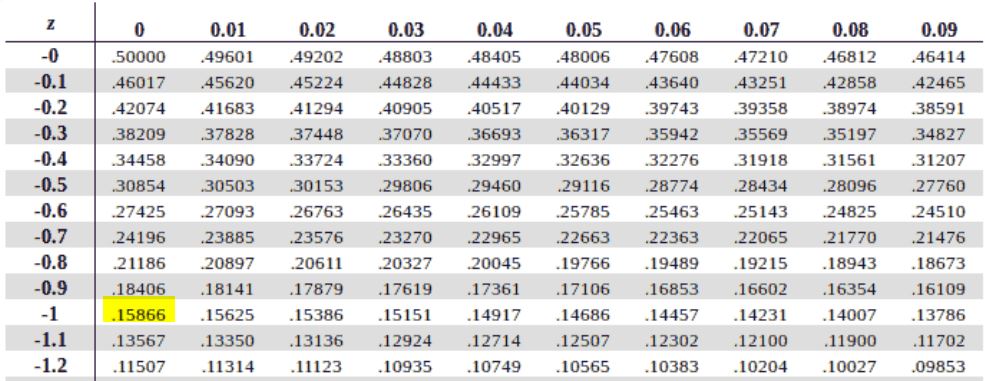
Case 2: Negative Z Tables (tables that list negative z values or use symmetry)
To find the probability for a negative z-score using the negative standard normal tables, you should follow these steps:
- Find the row showing the first two digits of the z-score (for example, –1.2).
- Find the column showing the second decimal place (for example, 0.03).
- Locate the intersection between the row and column. The value where they meet gives the area to the left of the z-score, P(Z<z).
Note. If you are asked to find the right-tail probability, use: P(Z>−a)=P(Z<a)
Finding Probability Between Two Z Scores
When a question asks for the probability that a value lies between two z-scores, follow these steps:
- Find the left-tail probability for each z-score using the table.
- P(Z<a) for the smaller z-score.
- P(Z<b) for the larger z-score.
- Subtract the smaller probability from the larger one: P(a<Z<b)=P(Z<b)−P(Z<a)
- If working with negative values, apply the symmetry rule first to convert them into positive equivalents before performing the subtraction.
Note. The symmetry rule for z-score probability states that the normal distribution is perfectly symmetrical around the mean. This means that the area under the curve for a positive z-score is equal to the area for a negative z-score of the same magnitude.
Looking for an Easier Way to Find Z Score Probabilities? Don’t worry! We understand that manually checking z-tables can be slow and confusing, especially when dealing with multiple z-scores or tail areas. To save time, try our Z Score Probability Calculator. It automatically computes left-tailed, right-tailed, and and probabilities between two z scores. It also displays a shaded normal curve showing the exact area under the curve for your z-score.
Examples: Finding Probability from a Z Score
Let’s look at a few simple examples to understand how to find probabilities from z-scores using the z-table.
Example 1: Left-Tail Probability
Find P(Z<1.25)
- Locate 1.2 in the left column and 0.05 in the top row of the z-table.
- The intersection gives 0.8944 (Figure 2).
- This value represents the area to the left of z = 1.25.
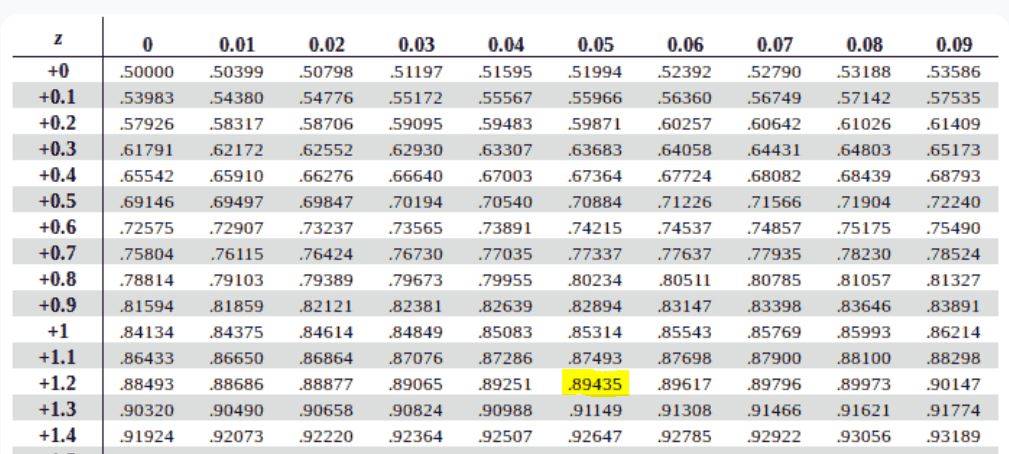
Thus, the probability that Z is less than 1.25 is 0.8944, or 89.44%.
Example 2: Right-Tail Probability
Find P(Z>1.25)
- From Example 1, P(Z<1.25)=0.8944.
- The right-tail probability is the complement of the left-tail. Thus, P(Z>1.25)=1−P(Z<1.25)
- Substitute the value: 1−0.8944=0.10561
Thus, the probability that Z is greater than 1.25 is 0.1056, or 10.56%.
Example 3: Probability Between Two Z Scores
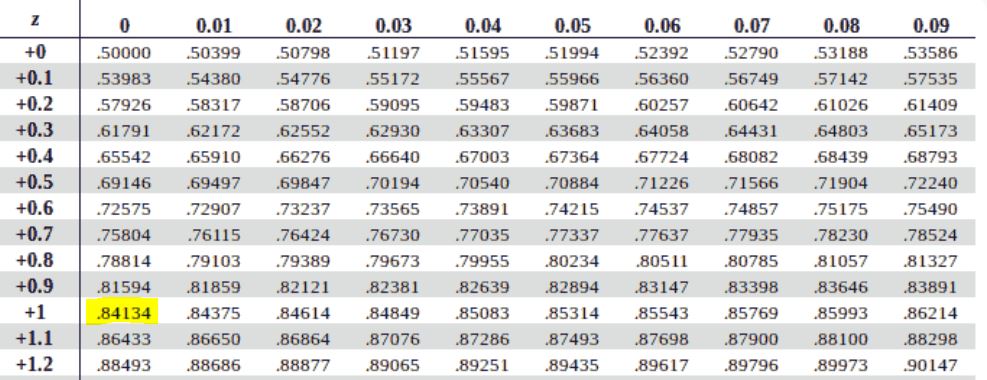
Find P(−1.00<Z<1.00)
- From the z-table:
- P(Z<1.00)=0.8413
- P(Z<−1.00)=0.1587
- Subtract the smaller area from the larger one: P(−1.00<Z<1.00)=0.8413−0.1587=0.6826
Recall. P(z <-1) = 1-p(z <1). This means you can still find p(z<-1) without using the negative z-table.
Therefore, the probability that Z lies between -1.00 and 1.00 is 0.6826, or 68.26%. This corresponds to the well-known 68% rule for the normal distribution.
Common Rules of the Standard Normal Distribution
The standard normal distribution follows a predictable pattern. In particular, most of the data values are close to the mean, and the probability decreases as you move further away. The most well-known rule that summarizes this pattern is the Empirical Rule, also called the 68–95–99.7 Rule.
This rule states that:
- About 68% of the data fall within 1 standard deviation of the mean. This implies that P(−1<Z<1)=0.6826
- About 95% of the data fall within 2 standard deviations of the mean. This implies that P(−2<Z<2)=0.9544
- About 99.7% of the data fall within 3 standard deviations of the mean. This implies that P(−3<Z<3)=0.9974
Tip: The empirical rule helps you quickly estimate probabilities and identify outliers without using a z-table. For example:
- If a value lies more than 2 standard deviations away from the mean, it’s relatively unusual.
- A value more than 3 standard deviations away is considered rare.
Frequently Asked Questions
A z score shows how far a data point is from the mean in terms of standard deviations. The probability from a z score represents the area under the standard normal curve to the left (or right) of that z value. It tells you the likelihood of observing a value less than or greater than a given point.
To find probability from a z score using the z table, locate the row for the first two digits of the z score and the column for the second decimal place. The intersection gives the area (probability) for that z score.
– For left-tail probability, use the value as it is.
– For right-tail probability, subtract the area from 1.
If the z table lists only positive values, use the symmetry of the normal distribution. In this case,
P(Z < -a) = 1 – P(Z < a). This means the probability to the left of a negative z score is the same as the probability to the right of its positive counterpart.
To find the probability between two z scores, follow these steps:
– 1) Look up both z scores in the table.
– 2) Subtract the smaller area from the larger area.
This gives the probability that the value falls between the two z scores.
The empirical rule (68–95–99.7 rule) summarizes probabilities in a normal distribution. The rule states that:
– About 68% of values fall within 1 standard deviation of the mean.
– About 95% fall within 2 standard deviations of the mean.
– About 99.7% fall within 3 standard deviations of the mean.
This rule helps estimate probabilities quickly without using a z table.
Yes. You can use an online z score probability calculator. It automatically finds left-tail, right-tail, and between two z-scores probabilities and displays the shaded normal curve for better understanding