A z score is a statistical measure that shows how many standard deviations a value is from the mean of a dataset. Simply stated, a z score tells you whether a number is above or below the average and by how much. For instance, if you scored 85 on a test where the average was 75, a z score can tell how many standard deviations above the mean your score is. In real-life situations, Z scores help us compare values from different groups, detect outliers, and find probabilities from a normal distribution. In this article, you’ll learn what a z score means, how to calculate it, and how to interpret it.
What is a Z Score? (Definition and Formula)
A z score, also known as a standard score, is a statistical measure that shows how many standard deviations a data point is from the mean of a dataset. It helps you understand whether a value is higher, lower, or equal to the average. A positive z score means the value is above the mean, while a negative z score means it is below the mean. However, if you happen to find a z score of zero, it means the data point is the same as the mean.
In statistics, z scores helps in standardizing the data. This consequently allows you to compare values from different datasets, even when the datasets have different means and standard deviations. This makes analysis easier and more meaningful.

Z Standard Score Formula
The z score formula is: z = (X−μ)/σ
Where:
- X is the individual data value
- μ is the mean of the dataset
- σ is the standard deviation of the dataset
Simply stated, a z score can be computed by subtracting the mean from the individual data point and dividing the results by the standard deviation.
Step-by-Step: How to Calculate a Z Score
Calculating a z score is simple if you follow a few clear steps. The goal is to find how far a value is from the mean in standard deviation units. To easily calculate z scores, simply follow these steps:
- Step 1: Calculate the Mean (μ) of your data
- Step 2: Calculate the Standard Deviation (σ) of your data
- Step 3: Subtract the Mean (μ) from Your Data Point (X)
- Step 4: Divide the difference by the Standard Deviation (σ) to get the z-score
Z Score Example
Suppose you scored 85 on a test where the class average was 75, and the standard deviation was 5. We can find the z score as follows:
From the example, we know that:
The mean, μ = 75, standard deviation, σ = 5, and the data point, X = 85
Applying the z standard score formula, z = (X-μ)/σ, we have:
z = (85-75)/5
=10/5
=2
Thus, z = 2, which is positive. This implies that your score of 85 is 2 standard deviations above the mean.
Want to skip the manual calculation or verify your results? Use our free Z Score Calculator to get instant and accurate results. Alternatively, you can check out our detailed guide on how to compute z scores in excel for better understanding.
Interpreting Z Scores
Interpreting a z-score helps you understand how far a data point is from the mean and whether it is above or below average. Each z score gives valuable information about a data point’s position in a normal distribution. Here’s a summary of how you should interpret the computed standard scores:
- A positive z score means the value is above the mean. For example, a z score of +1 shows the value is one standard deviation higher than the average.
- A negative z score means the value is below the mean. For instance, a z score of –2 shows the value is two standard deviations lower than the average.
- A z score of 0 means the value is exactly equal to the mean, showing no difference from the average.
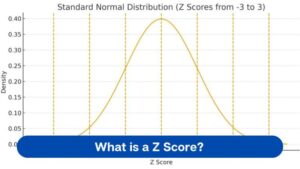
There is also an important concept after computing z-scores called the empirical rule. The Empirical Rule of standard normal distribution helps explain how data is spread. According to this rule:
- About 68% of data falls within ±1 standard deviation of the mean.
- About 95% of data falls within ±2 standard deviations.
- About 99.7% of data falls within ±3 standard deviations.
Applications of Z Scores
Z scores play an important role in many areas of statistics, research, and everyday analysis. Notably, by showing how far a value is from the mean, they make comparisons clear and meaningful. Here are the most common applications of z scores:
- Comparing Scores from Different Tests or Measurements. Z scores make it easy to compare values that come from different scales. For example, you can compare a math test score with a science test score even if the tests have different means and standard deviations.
- Detecting Outliers. A z score helps you identify values that are unusually high or low. Values with z scores above +3 or below –3 are often considered outliers because they are far from the mean.
- Standardizing Data in Research and Statistics. Researchers use z scores to convert raw values into standardized units. This process allows them to analyze data from different groups in a consistent way.
- Finding Probabilities in a Normal Distribution. Z scores help you locate a value on the standard normal curve. This makes it possible to estimate how likely or rare a value is.
- Feature Scaling in Machine Learning. Many machine learning algorithms work better when features are standardized. Z score normalization transforms values so they have a mean of 0 and a standard deviation of 1.
- Quality Control and Process Monitoring. In industries like manufacturing and health care, z scores help track process performance. They show whether results fall within acceptable limits or if something needs attention.
Frequently Asked Questions
A z score tells you how many standard deviations a value is from the mean of a dataset. It shows whether a value is above, below, or equal to the average. It also helps you understand how common or rare a value is in a normal distribution.
Yes, a z score can be negative. A negative z score means the value is below the mean. The more negative it is, the farther the value is from the average.
A good z score depends on context. In most cases, a z score close to 0 means the value is typical. A high positive z score may be good if a high value is desirable, such as in test scores. In contrast, a very high or very low z score may signal an outlier.
To calculate a z score, subtract the mean from your value and divide the result by the standard deviation. If you want fast results, use our free Z Score Calculator or our guide on how to compute z scores in Excel.
A z score uses the population standard deviation, while a t score uses the sample standard deviation. Z scores are used for large samples, and t scores are used for small samples or when the population standard deviation is unknown.