After computing the F-test statistic for ANOVA, regression, or the F-test for equality of variance, you need to determine whether the results are statistically significant or not. Using the classical approach, you’ll need to find the F-critical value corresponding to your significance level (α), numerator degrees of freedom (df1), and denominator degrees of freedom (df2). In this case, you can either use the Excel F-critical value formula, the F-critical value calculator, or the F-distribution table.
F-Table for α = 0.005, 0.01, 0.025, 0.05, and 0.10 (pdf format)
The F-distribution table below provides critical values for the F-test based on numerator degrees of freedom (df1), denominator degrees of freedom (df2), and a chosen significance level (alpha) for right-tailed tests. It supports various significance levels (α = 0.005, α = 0.01, α = 0.025, α = 0.05, and α = 0.10).
You can also download the F-distribution pdf version if you want to use it locally.
How to Find F-Critical Value From F-Tables
To find the f-critical value for your F-test, follow these steps:
- Step 1: Select an F-table with your significance level (α)
- Step 2: Locate the numerator degrees of freedom (df₁) across the top of the table
- Step 3: Locate the denominator degrees of freedom (df₂) in the left column of the table
- Step 4: Find the intersection of df1 and df2. This gives you the critical value of 𝐹𝛼(𝑑𝑓1,𝑑𝑓2)
Example of Finding Critical F Value Using Tables
Scenario. A university administrator wants to find out whether three different training programs lead to different average job-placement test scores among final-year students. A total of 30 students are randomly assigned to the programs, with 10 students in each group. After completing the training, all students take the same standardized test. The administrator decides to analyze the results using a one-way ANOVA at a 5% significance level (α = 0.05). Find the F-critical value for this test.
Solution
To find the critical f-value for the test, we need to first identify the significance level, numerator degrees of freedom (df1), and the denominator degrees of freedom.
From the scenario, the significance level is α = 0.05. Also, since this is an ANOVA test, the degrees of freedom can be obtained as follows:
- Numerator degrees of freedom, df1 = k-1, where k is the number of independent groups. In this case, we have 3 independent groups. Thus, df1 = 3 – 1 = 2
- Denominator degrees of freedom, df2 = n-k, where n is the total sample size. From the scenario, the sample size = 30. Thus, n – k = 30-3 = 27
Next, we need to find the F-critical value from the appropriate table. Since we are testing the hypothesis at a 0.05 significance level, we need to use the F-table with a 0.05 significance level, as shown below.
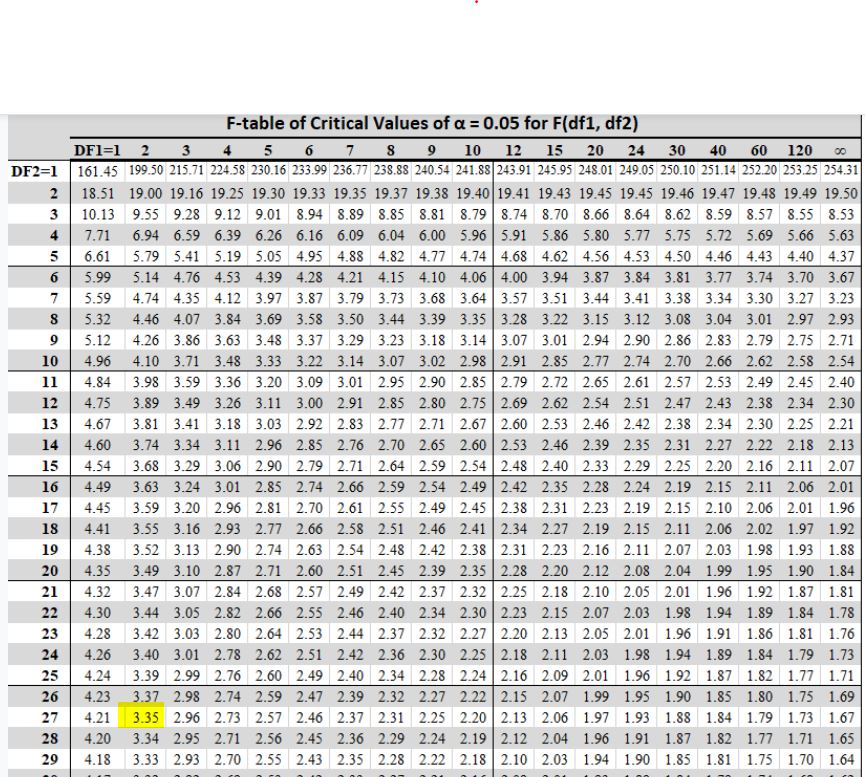
Locate the intersection of df1 = 2 and df2 = 27 from the table. This gives 3.35. Therefore, the appropriate F critical value for the test is F0.05(2, 27) = 3.35.
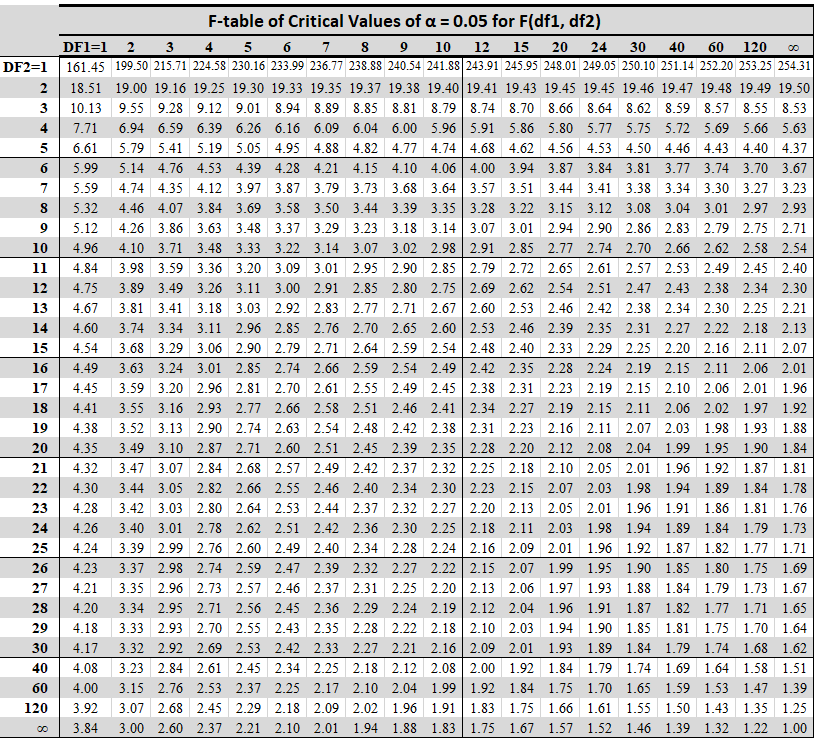
F-Critical Value Table for α = 0.05
Use this table if you want to be 95% confidence.
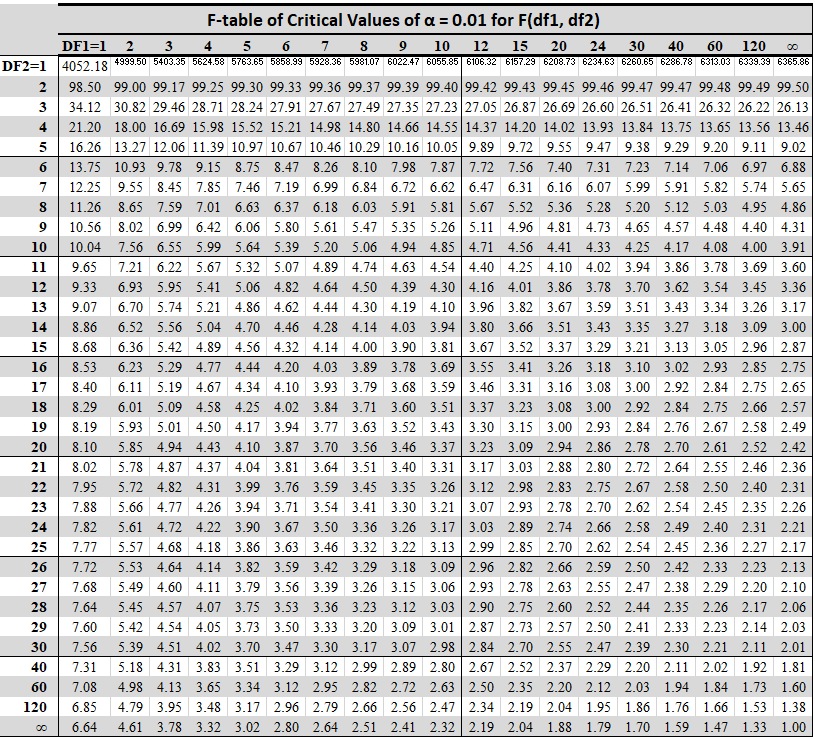
F-Critical Value Table for α = 0.01
Use this table if you want to be 99% confidence.
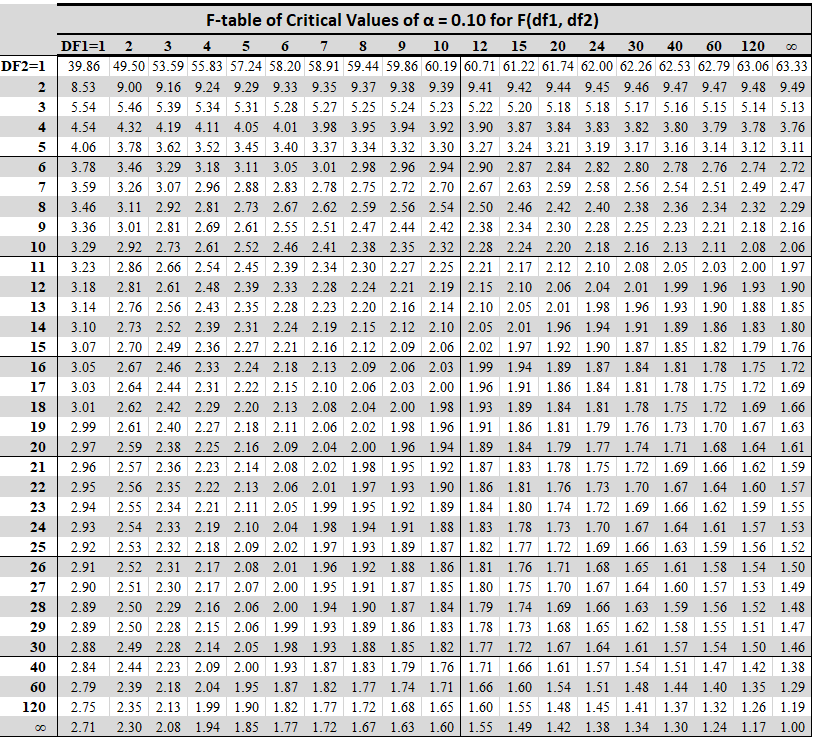
F-Critical Value Table for α = 0.10
Use this table if you want to be 90% confidence.