Use this Z Score Probability Calculator to easily convert z scores to probabilities. The calculator allows you to find probabilities from a standard normal distribution from a single z score or the area between two z scores. Instead of manually checking z-tables, it quickly gives you accurate left-tail, right-tail, between, or outside probabilities. It also shows a shaded normal distribution curve to help you see where your z value falls on the standard normal curve.
Probability from a Z-Score Calculator
ProbabilityUse this calculator to find probabilities from a single z-score or the probability between two z-scores under the standard normal distribution.
Probability Between Two Z-Scores
BetweenWhat is a Z Score Probability Calculator?
A Z Score Probability Calculator is an online tool that helps you find probabilities under the standard normal distribution using one or two z-scores. It helps you find the probability of a single z-score (the area to the left or right of a value) or the probability between two z-scores.
Thus, with the calculator, you can easily find these probabilities instantly, without referring to long z-tables or doing manual calculations. Our calculator also includes a graph with shaded areas that helps you visually understand where your z-score lies on the normal distribution curve.
How to Use the Calculator: Step-by-step
Follow these simple steps to convert z-scores to probabilities using the calculator:
i) Single z-score (one value)
To calculate probability from a single z score, follow these steps:
- Enter the z value in the “Enter Z value” box.
- Click the “Calculate” button.
- Read the results shown below the input. You will see P(x < z), P(x > z), P(0 < x < z), P(-z < x < z), and P(x < -z or x > z).
- Look at the graph. The shaded area matches the probability you selected or viewed.
- If you want a different probability type (left, right, between 0 and z, etc.), use the displayed values. No extra input is needed.
ii) Between two z-scores
To find the area between two z-scores using the calculator, follow these simple steps:
- Go to the “Probability Between Two Z-Scores” section.
- Enter the left bound in Left Bound (Z1).
- Enter the right bound in Right Bound (Z2).
- Click the “Calculate” button.
- Read P(Z1 < x < Z2) shown under the inputs.
- Check the graph to see the shaded area between Z1 and Z2.
Quick tips and common mistakes
- Make sure Z1 < Z2 when using two bounds. If not, swap them.
- The calculator works on z-scores only. If you have raw data, convert it to a z-score first.
- Small rounding differences may appear (results are shown to 5 decimal places).
Key Features of the Calculator
The Z Score Probability Calculator is very easy to use. It helps you find the probability or area under the standard normal curve for one or two z-scores. You don’t need to look up any z-tables; the calculator does all the math for you.
There are two main parts of the calculator:
1. Probability from a Z Score Converter
In this section, you simply enter a single z-score and the calculator shows several probabilities, including:
- The probability that a value is less than x.
- The probability that a value is greater than x.
- The probability that a value lies between 0 and x.
- The probability that a value lies between -x and x
- The probability that a value is outside the range -x to x (both tails).
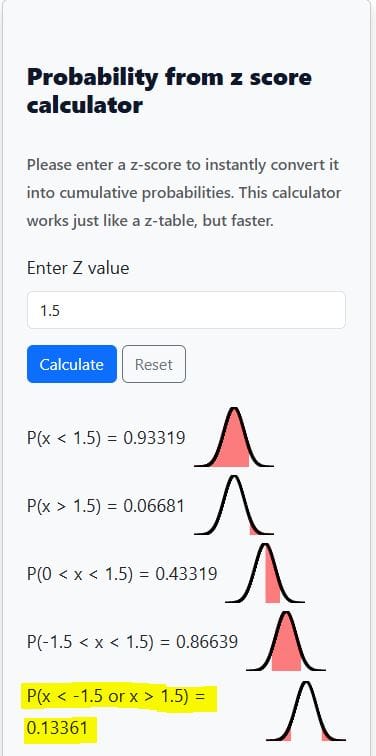
For example, when you enter 1.5, the calculator gives:
- P(x < 1.5) = 0.93319
- P(x > 1.5) = 0.06681
- P(0 < x < 1.5) = 0.43319
- P(-1.5 < x < 1.5) = 0.86639
- P(x < -1.5 or x > 1.5) = 0.13361
A graph also appears showing a bell-shaped curve with the shaded area that matches your selected probability. This helps you see where your z-score falls and what part of the curve it covers.
2. Probability Between Two Z Scores Converter
This section of the calculator allows you to find the probability between two z values. You simply enter a Left Bound (Z1) and a Right Bound (Z2), and the calculator finds the area between these two z scores for you.
For example, if you enter Z1 = -1 and Z2 = 1, the calculator shows:
- P(-1 < x < 1) = 0.68269
Note. This calculator is based on the standard normal distribution, which has a mean of 0 and a standard deviation of 1. To use it correctly, you need to first convert your raw data value into a z-score. If you don’t have a z-score yet, you can easily compute it using our Z Score Calculator, which automatically standardizes your data for you.
Z Score Probability Formula
The probability linked to a z-score comes from the standard normal distribution, which is a normal distribution with mean = 0 and standard deviation = 1. The cumulative probability of a z-score tells us the likelihood that a random variable z will take a value less than or equal to that z-score.
Mathematically, the z probability formula is:
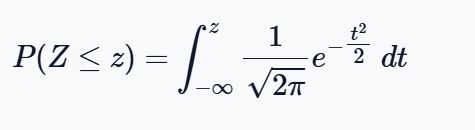
This formula looks complex, but here’s what it means:
- $ \frac{1}{\sqrt{2\pi}} e^{-\tfrac{z^2}{2}} $ is the probability density function of the standard normal distribution.
- The integral sums up all probabilities from −∞ (far left) up to your chosen z-value.
- The result is the cumulative probability, or the shaded area under the normal curve to the left of z.
Because the standard normal has a mean of 0 and a standard deviation of 1, every probability calculation depends only on the z-score itself.
Finding Probabilities from Z-scores using the Calculator: Solved Examples
The Z Score Probability Calculator makes it easy to compute all common types of probabilities under the standard normal distribution. Here are the four main cases, each with an example solved using the calculator.
1. Left-Tail Probability, P(Z<z)
This is the probability that a value lies to the left of a given z-score.
Example 1: A college admissions test is normally distributed with a mean of 500 and a standard deviation of 100. What proportion of students score below 595?
Solution
- Step 1 (Find z): $$ z = \frac{595 – 500}{100} = 0.95$$
- Step 2 (Use calculator): Enter z=0.95 and click the “calculate” button
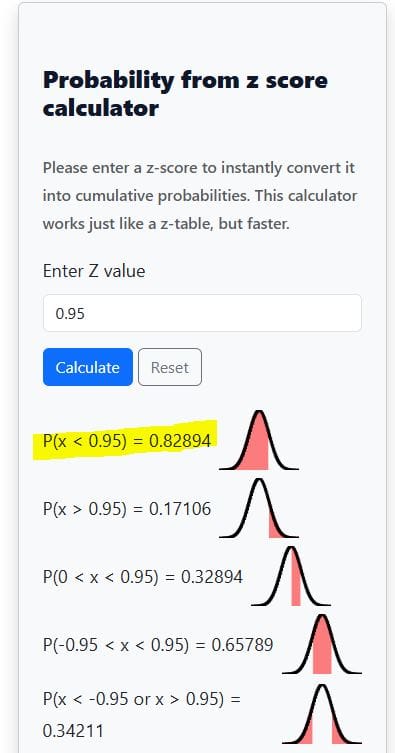
- Result: P(Z<0.95)≈0.8289
- Interpretation: About 82.9% of students score below 595.
Want a tool that only shows the left-tailed probability instead? Use the area to the left of z-score calculator.
2. Right-Tail Probability P(Z>z)
This gives the probability of a value being greater than a given z-score.
Example 2: A manufacturer knows that lightbulb lifespans are normally distributed with a mean of 1200 hours and a standard deviation of 150 hours. What proportion of bulbs last longer than 1110 hours?
Solution
- Step 1. Find z. z = (1110 – 1200)/150 = -0.60
- Step 2. Use the calculator. Enter z=−0.60 and click the “Calculate” button
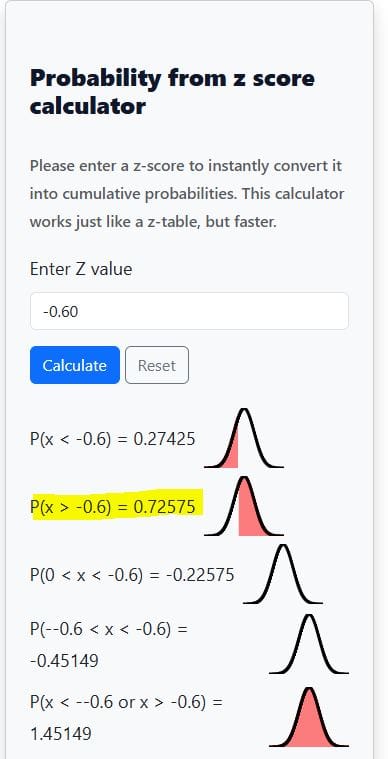
- Result: P(Z>−0.6)≈0.7257.
- Interpretation: About 72.6% of bulbs last longer than 1110 hours.
Looking for a dedicated tool to find the probability to the right of z? Use the area to the right of the z calculator.
3. Between Two Z-Scores P(a<Z<b)
This gives the probability of a value falling between two z-scores.
Example 3: Heights of adult men are normally distributed with a mean of 70 inches and a standard deviation of 3 inches. What proportion of men are between 66 and 74 inches tall?
- Step 1. Find z-scores. Z1 = (66 – 70)/3 = -1.33. Similarly, Z2 = (74 – 70)/3 = 1.33
- Step 2. Using the calculator, enter −1.33 and 1.33 and hit the “Calculate” button. You’ll get the required probability, as shown below
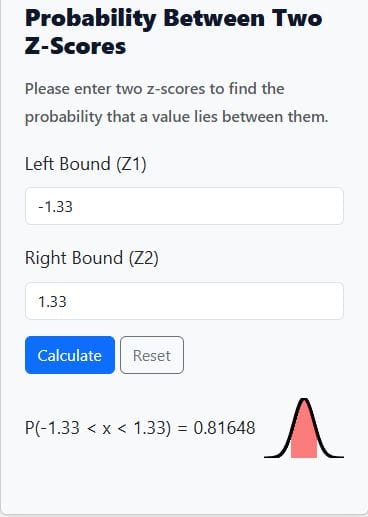
- Result: P(−1.33<Z<1.33)≈0.8165
- Interpretation: About 81.7% of men are between 66 and 74 inches tall.
Want to quickly find the probability between two z-scores without confusion? Use the area between two z-score calculator.
4. Outside Two Z-Scores P(Z<a or Z>b)
This gives the probability of a value being less than the lower bound or greater than the upper bound.
Example 4: IQ scores are normally distributed with mean 100 and standard deviation 15. What proportion of people have an IQ below 77.5 or above 122.5?
Solution
- Step 1 (Find z-scores): $$z_1 = \frac{77.5 – 100}{15} = -1.5$$ , $$\quad z_2 = \frac{122.5 – 100}{15} = 1.5$$
- Step 2 (Use calculator): Enter the absolute value (In this case, 1.5)
- Result: P(Z<−1.5 or Z>1.5)≈0.1336
- Interpretation: About 13.4% of people fall outside this range of IQs.
Want to learn more how to convert z scores to probabilities manually? Check out our comprehensive guide on how to find probabilities from z score.
Frequently Asked Questions
A Z Score Probability Calculator, also called a Normal Distribution Calculator, is an online tool that computes probabilities for any z-score under the standard normal distribution. It shows left-tail, right-tail, between, and outside probabilities with a shaded curve for easy visualization.
Simply enter one z-score to get all cumulative probabilities (left-tail, right-tail, and outside). If you want the probability between two values, enter both z-scores, and the calculator will display the exact probability along with a shaded normal distribution graph.
Yes, the calculator works as the digital version of a z-table. Instead of manually looking up values, the Z Score Probability Calculator gives precise probabilities instantly and allows for decimal z-scores that are often missing in printed tables.
Absolutely. Many students and researchers use the calculator to find critical values, p-values, and tail probabilities needed in z-tests, confidence intervals, and other hypothesis testing scenarios.
The left-tail probability (P(Z
Yes. If you enter two z-scores, the Normal Distribution Calculator returns the probability of a value falling between them and highlights the shaded area on the normal curve. It can also calculate the probability of being outside those two values.