This free online calculator finds the area between two z-scores and provides a detailed step-by-step solution. You’ll also see a visual graph showing the shaded area under the standard normal curve. Just enter the lower z-score (Z₁) and upper z-score (Z₂) to instantly calculate the probability between these two values.
Want to calculate probability from a single z score? Use the z-score probability calculator instead.
How to Use the Area between Z Scores Calculator
To find the probability between any two z-scores using this calculator, simply follow these steps:
- Enter the lower z score (Z₁)
- Enter the Upper z score (Z₂)
- Click the “Calculate” button
The calculator will instantly return the area between these two z scores in decimal and percentage format. It will also show you how to find the area manually, step-by-step.
What Is the Area Between Two Z Scores?
The area between two z-scores represents the probability that a value from a standard normal distribution falls between them. It is calculated using the formula:
P(Z1<X<Z2)= Φ(Z2)−Φ(Z1)
Where:
- Z₁ = lower z-score value
- Z₂ = upper z-score value
- Φ = cumulative probability derived from a standard normal table.
This probability corresponds to the shaded area under the standard normal curve between the two z-scores.
How to Find the Area Between Two Z Scores (Step-by-Step)
Finding the area between two z-scores is easy when you follow these steps. Still struggling with finding the probability between z-scores? Follow these simple steps:
Step 1: Identify Z₁ and Z₂
Start by determining the lower z-score (Z₁) and the upper z-score (Z₂) for the values you want to examine. These are the boundaries of the area you’re calculating.
Step 2: Use the Z Table
Look up each z-score in the Z table.
Recall. The Z table shows the area to the left of a given z-score. This means it tells you the probability that a value is less than that z-score.
Step 3: Apply the Formula
Now subtract the cumulative probability of the lower z-score from that of the upper z-score. That is; apply the formula: P(Z1<X<Z2)= Φ(Z2)−Φ(Z1)
This gives you the probability, or the area under the standard normal curve, that lies between Z₁ and Z₂.
Step 4: Interpret the Result
Finally, interpret the probability in context. For example, if the result is 0.68, it means that 68% of values in a standard normal distribution fall between Z₁ and Z₂.
Example: Find the Area Between Z = -0.75 and Z = 1.25
To find the probability between Z = -0.75 and Z = 1.25, follow these steps:
Step 1: Identify Z₁ and Z₂
From the question:
- Lower z-score, Z₁ = -0.75
- Upper z-score, Z₂ = 1.25
Step 2: Use the Z Table
From a negative z-table, look up the value at the intersection of -0.7 in the row and 0.05 in the column. This gives you 0.2266. Thus, Φ(-0.75) = 0.2266
Next, using a positive z-table, look up the value at the intersection of 1.2 in the row and 0.05 in the column. The intersection is 0.8944. Thus, Φ(1.25) = 0.8944
Step 3: Apply the Formula
The formula is P(Z1<X<Z2)= Φ(Z2)−Φ(Z1)
Thus, P(−0.75<X<1.25) = 0.8944−0.2266
=0.6678
Step 4: Interpret the Result
The probability between Z = -0.75 and Z = 1.25 is 0.6678, or 66.78%. This means that approximately 67% of all values in a standard normal distribution fall between these two z-scores.
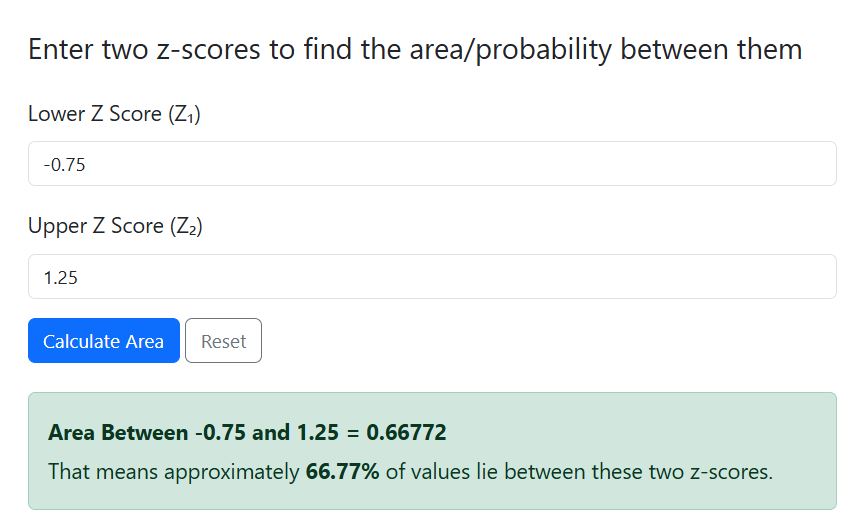
Want to cross-check these results? Enter Z1 = -0.75 and Z2= 1.25 in the calculator and click the “calculate” button. The calculator yields similar results, as shown below.
Want to learn more about finding probabilities from z score? Check out our guide on how to find probability with z score.
Frequently Asked Questions
Simply enter the lower bound (Z₁) and upper bound (Z₂) into the input fields, then click “Calculate.” The calculator will instantly show the probability, a step-by-step solution, and a shaded graph of the area.
Yes! The calculator handles negative z-scores automatically. It calculates the area correctly whether your z-scores are negative, positive, or a mix of both.
No problem. The calculator will automatically swap the values to ensure Z₁ is the lower bound and Z₂ is the upper bound. The probability and graph will still display correctly.
No. This calculator only works with z-scores. If you have raw values, you first need to standardize them to z-scores using the formula z = (z-μ)/σ. Alternatively, you can use our Z Score Calculator to convert raw values to z-scores before using this tool.
Yes! The calculator displays a shaded area under the standard normal curve between your two z-scores. This helps you visualize the probability you just calculated.