This calculator computes the area to the left of z and shows you how to find this value, step-by-step. It also shows a graphical representation of the area to the left under the standard normal curve.
Just enter the z value and click the “Calculate” button to get instant results and a clear, step-by-step solution.
Want to find the area to the left of z, right of z, and between two z-scores all in one place? Use the free z-score to probability calculator.
How to Use the Area to the left of Z Calculator
To find the area/probability to the left of a z value using this calculator is straightforward. Just follow these simple steps:
- Step 1. Enter the Z value (If you have raw scores, convert them to Z first)
- Step 2. Click the “Calculate” button
The calculator will instantly return the correct probability to the left of z in decimal and percentage form, along with a clear, step-by-step solution showing you how to find this value using the standard normal table. At the end, you’ll find a graphical representation of this probability/area under the standard normal curve.
What is the area to the left of z?
Definition: The area to the left of z refers to the cumulative probability under the standard normal distribution curve that lies to the left of a specific z-score. It represents the probability that a randomly selected value from a standard normal distribution (with mean 0 and standard deviation 1) is less than or equal to a given z-value.
Mathematically, the formula is P(Z≤z)
How to Area to the Left of Z From Tables
Want to learn how to find the area to the left of z using tables? Finding this area using a Z table is straightforward. Just follow these steps:
Step 1. Identify the Z-Score
Start with the given z-score. If you have the raw scores instead, convert them to z using the formula z = (X−μ)/σ. However, if you want to convert X to Z quickly, you can use the z-score calculator.
Step 2. Split the Z-Score into Row and Column Values
In a standard Z table:
- The row contains the first two digits of the z-score (including the first decimal place).
- The column contains the second decimal place.
For example, if z = 1.96, the raw will show 1.9, and the column will show 0.06
Step 3. Locate the Value in the Z Table
Using the Z table, locate the value at the intersection of the correct row and the correct column. This will give you the area to the left of that z-score.
Note. Most standard Z tables already provide cumulative probabilities (area to the left). As such, you don’t need to do any further calculations.
Step 4. Interpret the Result
The value you obtain represents the probability that a randomly selected value from the standard normal distribution is less than or equal to the given z-score.
Example
Find the area to the left of z = 1.96.
Solution
- Identify the z-score. The z value is 1.96
- Using the Z table,
- Locate 1.9 in the row
- Locate 0.06 in the column
- Locate the value at the intersection of 1.9 (row) and 0.06 (column). The value is 0.9750.
- Interpretation: The value to the left of z = 0.9750. That is, P(Z≤1.96)=0.9750. This means that 97.50% of the distribution lies to the left of 1.96.
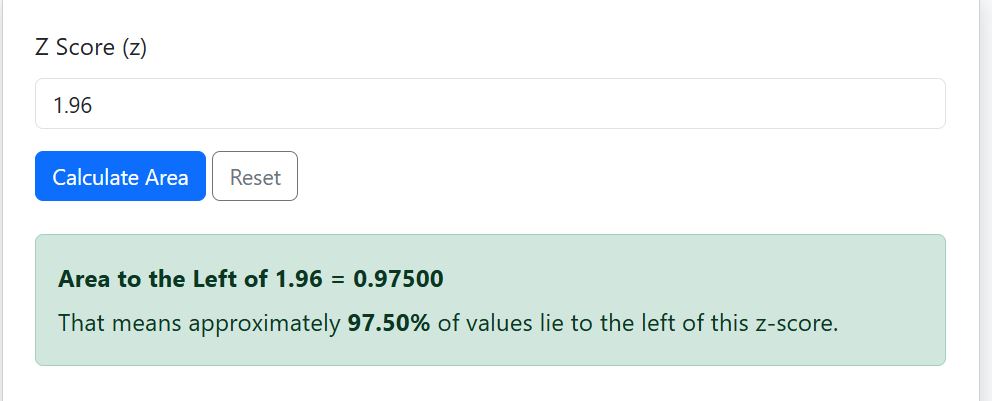
You can also confirm these results using the calculator. Just enter 1.96 as the z-value and click the “Calculate” button. You’ll get similar results, as shown below.
When should I use the Area to the Left of Z Calculator?
You should use this calculator when you need to:
- Find cumulative probability quickly
- Determine percentiles
- Perform hypothesis testing
- Calculate p-values from z score
- Avoid manual Z table lookup
It is especially useful for students, researchers, and professionals working with normal distribution problems.
Frequently Asked Questions
The area to the left of z represents the cumulative probability that a value from the standard normal distribution is less than or equal to a given z-score. This value shows the percentage of data that falls below that z-score on the standard normal curve.
The area to the left of z is expressed as: P(Z≤z)=Φ(z), where Φ(z) is the cumulative distribution function (CDF) of the standard normal distribution.
Yes. The calculator automatically computes the correct cumulative probability for both positive and negative z-values without the need for manual adjustments.
Yes. While Z tables are usually limited to 2–4 decimal places, this calculator provides more precise results and eliminates lookup errors.
This Area to the Left of Z Calculator displays the result in both decimal and percentage formats for easy interpretation. In addition, the calculator provides a graphical representation of the normal distribution curve, where the area to the left of your z-score is shaded.