This calculator finds the area to the right of z and give answer in decimal and percentage form. The calculator also provides a step-by-step solution to help you learn how to find this area using Z tables. You’ll also see a graphical representation of the shaded area to the right of z.
Simply enter a z-score and click the calculate button to get instant results with a clear, step-by-step solution now!
Do you want a one-in-all calculator that computes various cumulative probabilities from z? Use the z-score to probability calculator instead.
How to Use the Area to the Right of Z Calculator
Finding the area to the right of z using this tool is straightforward. You don’t need to use the standard normal tables. Just follow these simple steps:
- Step 1. Enter your z value
- Step 2. Click the “calculate” button
The calculator will instantly return the probability to the right of z as a decimal/percentage. It also provides a clear, step-by-step solution, explaining how you can find this area using the standard normal table. Notably, you also get to see how you can represent this area on a standard normal curve.
What is the Area to the Right of a z-score?
The area to the right of a z-score represents the probability that a value from a standard normal distribution is greater than that z-score.
The formula for finding the area to the right of z is P(Z>z)=1−Φ(z)
Where Φ(z) is the cumulative probability (area to the left) from the standard normal distribution table.
The result represents the right-tail probability under the standard normal curve.
How to Find the Area to the Right of a Z Score (Step-by-Step)
Step 1: Identify the Z Score
Start with the given z-score. This is the value that marks the boundary of the right-tail region.
Step 2: Use the Z Table
Look up the z-score in the Z table.
Remember: the Z table gives the area to the left of a z-score (Φ(z)).
Step 3: Apply the Formula
Since we want the area to the right, subtract Φ(z) from 1.
Thus, P(Z>z)=1−Φ(z)
Step 4: Interpret the Result
The result represents the probability that a value from the standard normal distribution is greater than your z-score.
Example
Question. The scores on a statistics final exam are normally distributed with a mean of 70 and a standard deviation of 8. Find the probability that a randomly selected student scores more than 82.
Solution
Step 1. Identify the Z score
We need to find P(X > 82)
From the question, we’re provided with a raw score and not a z-score. Thus, we first need to calculate the z score using the formula z = (X−μ)/σ
We know that the raw score, X = 82, population mean, μ =70, and the population standard deviation, σ = 8
Thus, z = (82-70)/8
= 1.5
Want to quickly find z score from the raw score? Use the raw to z-score calculator
Thus, we should find P(Z > 1.5)
Step 2. Using the Z table
The z table gives the area to the left of z. Using a positive z table, find the value at the intersection of 1.5 in the row and 0 in the column. This gives 0.9332
Thus, the area to the left of z = 1.5 is 0.9332. That is, Φ(1.50) = 0.9332
Step 3. Apply the formula
We apply the formula and subtract the area to the left of z from 1.
Thus, P(Z>1.50)=1−0.9332
=0.0668
Step 4. Interpretation
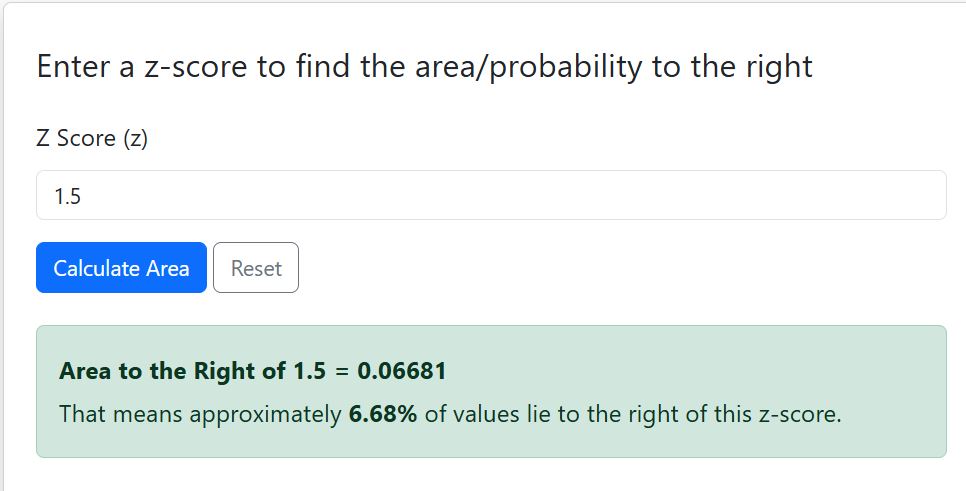
The probability that a randomly selected student scores more than 82 is 0.0668 or 6.68%. In other words, about 6.7% of students will score higher than 82.
Note. The area to the right of z score calculator will also yield similar results, as shown below.
Related. How to Find Probability from Z Using Standard Normal Tables
Frequently Asked Questions
Enter a z-score and click “Calculate.” The calculator will display the probability to the right, show a step-by-step solution, and provide a shaded graph of the right-tail area.
Yes. The calculator works for positive and negative z-scores. A negative z-score will produce a larger right-tail probability.
No. You must first convert your raw value to a z-score using the formula z = (X−μ)/σ
The area to the right of a Z-score represents the probability that a value from a standard normal distribution is greater than the given Z-score. It is also called the right-tail probability.
Yes! Our calculator generates a standard normal curve and shades the area corresponding to the probability, making it easier to interpret.