A 5-number summary is a simple way to describe a dataset using 5-key statistics: the Minimum, First Quartile (Q1), Median (Q2), Third Quartile (Q3), and Maximum.…
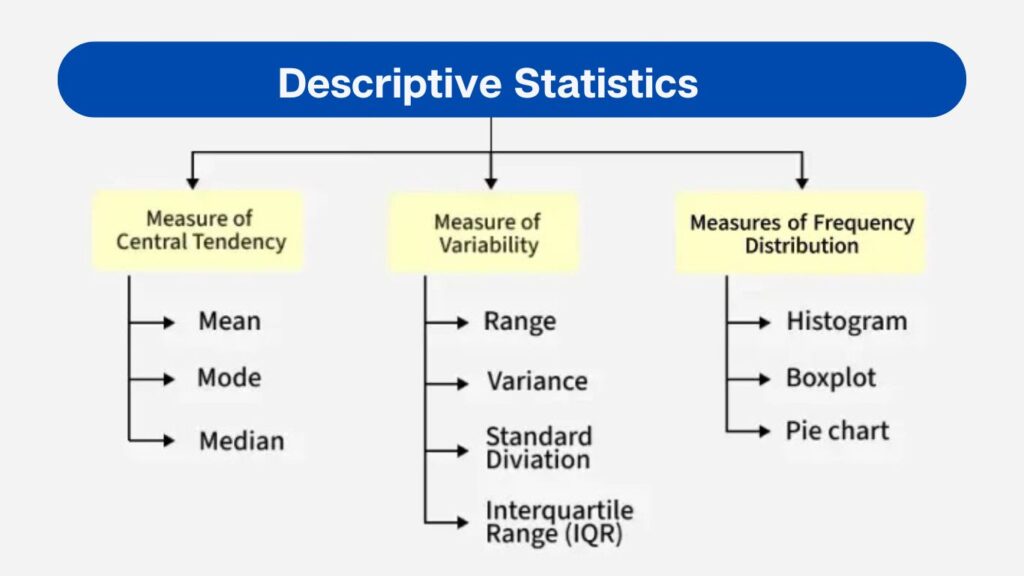
Descriptive statistics are methods or techniques that are widely used to organize and summarize data in a clear and simple way. In data analysis, descriptive statistics…
The sample mean is the average of a subset of data points collected from a larger population. To calculate the sample mean, you sum all the…
After performing an F-test for ANOVA, equality of variance test, or a regression model, you obtain an F-test statistic. The next step involves finding an F-critical…
After calculating the t-test statistic, the next step is finding a t-critical value to help you decide whether or not to reject the null hypothesis. If…
The t-critical value is an essential part of statistics and hypothesis testing. It helps you decide whether your results are significant or just due to chance.…
Have you just been introduced to the binomial probability formula and are wondering how you can use it to calculate binomial probability? This article shows you…
The mean of the binomial distribution is also known as its expected value. It represents the average number of successes you would expect over many repetitions…
After performing a z-test, the next step is deciding whether to reject the null hypothesis. This decision is based on the z critical value. If the…