This sample size calculator determines the minimum number of respondents you need for your survey or research study. Simply enter your confidence level, margin of error, population size (if known), and estimated proportion to get instant results with a clear, step-by-step solution.
How to Use the Sample Size Calculator
Want a quick way to determine the appropriate sample size for your survey/research? Follow these steps to calculate the sample size using the online calculator:
- Step 1: Enter the Confidence Level
- Step 2: Enter the Margin of Error
- Step 3: Set the Population Proportion
- Step 4: Enter the Population Size (If Known).
- Step 5: Click the “Calculate” button to get instant results with a clear, step-by-step explanation.
What is Sample Size?
When conducting research, data must be collected from a target population. However, collecting data from every member of a population is often impractical, time-consuming, and expensive, especially when the population is large.
For this reason, researchers typically collect data from a representative sample rather than the entire population. A well-chosen sample allows researchers to draw conclusions that accurately reflect the characteristics of the whole population.
This raises an important question: how many respondents are required for a sample to accurately represent the population?
To answer the question, let’s first define sample size.
Definition: Sample size refers to the number of individuals, observations, or responses that you should include in a survey or study instead of collecting data from every member in the target population. Basically, it represents the number of individuals from the target population that should be included in your study for analysis.
But why do you need to choose an appropriate sample size for your study? Choosing the right sample size for your research ensures:
- Your results are accurate
- The statistical conclusions are reliable
- The findings can be generalized to the target population.
Tip. Choosing a very small sample will produce unreliable results. However, choosing a very large sample can waste time and resources without improving the accuracy of your results. Therefore, you should always use a representative sample size.
How Do You Choose a Representative Sample?
Now, you must be asking, “How can I choose a representative sample?” Choosing a representative sample involves selecting a smaller group of respondents that will have similar characteristics to the target population. This requires careful consideration of who to include and how many individuals to include (without wasting time and resources).
If you wish to know which units of the target population to include, then you must understand the different sampling techniques and choose the most appropriate. However, if you want to know the number of respondents you should draw from the target population, for reliable and statistically valid results, you need to learn how to determine the sample size.
While there are many sample size determination formulas, most researchers conducting surveys or quantitative research rely on a well-established formula. The formula accounts for various factors, including:
- Confidence level
- Margin of error
- Population size
- Estimated population proportion
This sample size formula is n₀ = Z²·p(1–p)/e²
Where:
- n is the required minimum sample size
- Z is the Z-score corresponding to the selected confidence level
- p is the estimated population proportion
- e is the desired margin of error
Note. The above sample size formula works for an infinite population. However, if you’re sampling data from a finite population, you need to adjust the sample size using the finite population correction (FPC) factor.
The finite population correction factor is n = n₀ / [1 + ((n₀–1)/N)]
Where:
- n is the adjusted sample size
- n₀ is the sample size calculated using the sample size formula
- N is the number of participants in the target population
Adjusting the sample size helps account for the total population, hence ensuring you obtain a more accurate estimate of the sample size.
How to Compute Minimum Sample Size: Examples
Now that you understand the sample size formula, let’s see how you can apply it to determine the number of participants you need for your research.
Example 1: Large (Infinite) Population
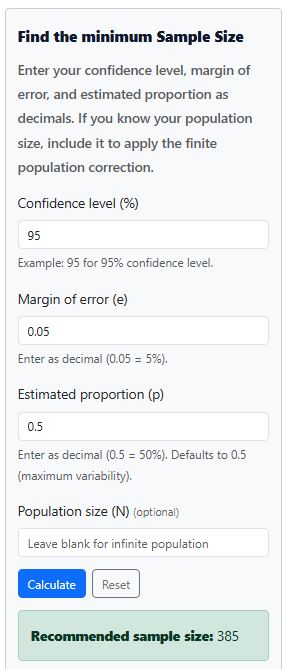
Suppose a researcher wants to conduct a national survey targeting all adults in a country. Because the population is extremely large, surveying every individual is impractical, so the researcher needs to determine the number of respondents required to produce reliable and statistically valid results while aiming for a 95% confidence level, a margin of error of 5%, and no prior estimate of the population proportion.
Solution
From the question, we know:
- Confidence level = 95%. Thus, z = 1.96.
- Margin of error, e = 0.05 (5%)
- Since no prior estimate of the population proportion, we use the standard, p = 0.5
Now, to compute the sample size, we apply the formula and substitute the values
Thus, n₀ = 1.96²·0.5(1–0.5)/0.05²
= 0.9604/0.0025
= 384.16
Rounding up to the nearest whole number, we have: n₀ = 385
Therefore, assuming an infinitely large population, the researcher should collect data from 385 participants in the target population.
Similarly, using the sample size calculator, we get the same results as shown below:
Example 2: Finite Population
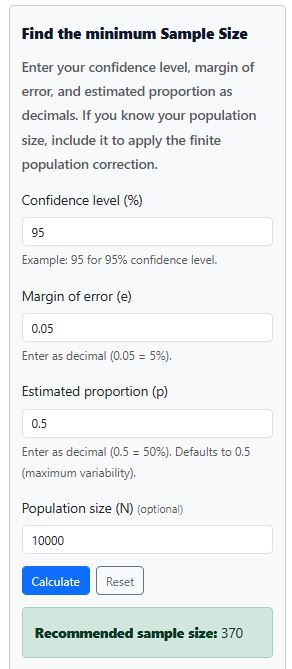
Following the previous scenario, suppose the researcher now plans a survey where the target population consists of 10,000 adults. Because the population is finite, the researcher needs to determine the number of respondents required to produce reliable and statistically valid results while aiming for a 95% confidence level, a margin of error of 5%, and no prior estimate of the population proportion.
Solution
Since the parameters are the same, the unadjusted sample size is n₀ = 384.16
Now, since the population is finite (N = 10,000), we should adjust the sample size using the finite population correction.
Applying the finite population correction formula, we have:
n = 384.16 / [1 + ((384.16–1)/10000)]
= 384.16/(1+0.038316)
=369.98
Rounding up to the nearest whole number gives n = 370 participants.
Similarly, using the calculator, you only need to specify the finite population size, N = 10,000 and hit the calculate button. This yields similar results as shown below.
Wondering how the z-score is obtained from the confidence level? Check out a detailed guide on how to find the z-critical value, or use a z-critical value calculator to find the z value for any confidence level. You can also refer to the table below for z-values corresponding to the commonly used confidence levels
| Desired Confidence Level | Z-Score |
|---|---|
| 80% | 1.282 |
| 85% | 1.440 |
| 90% | 1.645 |
| 92% | 1.751 |
| 95% | 1.960 |
| 96% | 2.054 |
| 97% | 2.170 |
| 98% | 2.326 |
| 99% | 2.576 |
| 99.9% | 3.291 |
Factors to Consider When Determining the Sample Size
While understanding the sample size formula and how to substitute values in the formula is important, you also need to understand what each of the parameters means. This will help you also understand how changing one can influence the sample size.
Here are the 4 key parameters you need to understand when computing the sample size.
1. Population Size
This is the total number of units in the target population. Increasing population size has a minimal to negligible effect on the required sample size. This is particularly notable when the population exceeds a certain threshold. You can try increasing the population size from 10,000 using the calculator to note the negligible increase in the sample.
2. Confidence Level
This measures how confident you want the results to reflect the true opinion of the target population. A higher confidence level will yield a larger sample size.
3. Margin of Error
The margin of error is how much error you are willing to accept in your results. A smaller margin of error means your results will be more precise, but it also means you need a larger sample size.
4. Variability (Proportion in Population)
Variability refers to how different or similar the population is in terms of the characteristic you are studying. When there is more variability (for example, a 50/50 split in opinions), you need a larger sample size to capture that diversity. If the population is more uniform (for example, 90% agree on something), then a smaller sample size is enough.