This calculator finds the five-number summary (Min, Q1, Median, Q3 & maximum) for any dataset. It also provides a step-by-step explanation, showing exactly how to compute each of the five numbers manually.
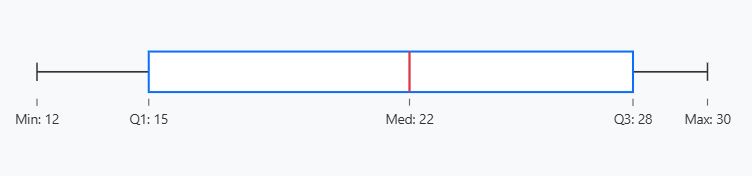
The calculator also visualizes the five-number summary using a box-plot.
Enter your data seperated by commas, spaces, tabs, or newlines. You can also paste data values directly from Excel and click Calculate.
How to Use the Five-Number Summary Calculator
Are you looking for a quick way to find the 5-number summary statistics for your data? Then, using the online calculator is the fastest way to find the Minimum, First quartile (Q1), Median, Third Quartile (Q3), and the maximum.
Here’s how the calculator works:
- Step 1: Enter the data and ensure it is separated by spaces or commas. You can also paste directly from Excel
- Step 2: Click the “Calculate” button
The calculator will give you 3 key outputs, which include:
- 5-number summary statistics
- A step-by-step explanation of how to compute these five numbers by hand
- A box plot visualizing the 5-number summary statistics
What is the Five-Number Summary?
Are you a first timer, or have you just come across the term “five-number summary“? Don’t worry! Here’s a simple definition.
Definition: A five-number summary is a set of key statistics that helps you get a quick overview of your dataset’s center, spread, and shape. These five sets of numbers include:
- Minimum. It is the smallest value in the dataset
- First Quartile (Q1). This is the median of the lower half of the sorted dataset (25th percentile).
- Median. This is the middle value in the dataset after sorting it either in ascending or descending order (50th percentile).
- Third Quartile (Q3). This is the median of the upper half of the sorted dataset (75th percentile).
- Maximum. It is the largest value in the dataset
How To Find the 5-Number Summary Statistics Using the Calculator: An Example
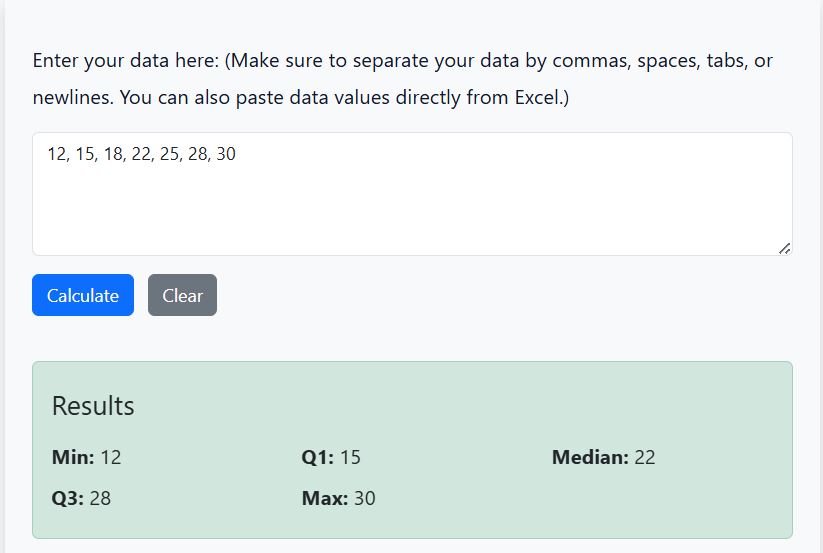
Suppose you have the following dataset: 12, 15, 18, 22, 25, 28, 30. You can easily compute the five-number summary using the calculator as follows:
- Copy and paste the values in the input section
- Click the “Calculate” button
- The calculator will give you the 5-number summary as:
- Minimum = 12
- Lower Quartile (Q1) = 15
- Median = 22
- Upper Quartile (Q3) = 28
- Maximum = 30 (See Figure 1)
The calculator will also represent the five numbers in a box plot (see Figure 2).
Want to learn more about the five-number summary? Check out the comprehensive guide on how to find the 5-number summary manually.