This r critical value calculator computes the critical values for Pearson’s correlation coefficient (r). Simply enter the sample size (n) and significance level (α), then click the “calculate” button to get instant results with a step-by-step explanation.
Whether you’re performing a two-tailed, right-tailed (positive), or left-tailed (negative) correlation test, this calculator provides the critical r values and shows how to interpret them.
Enter your sample size and significance level to compute the critical r values for two-tailed, right-tailed, and left-tailed Pearson correlation tests.
If you’re switching between correlation tests and other statistical procedures, our complete Critical Value Calculator makes it easy to compute all major critical values in one place.
How to Use the R Critical Value Calculator
Need a quick way to find critical values for your Pearson’s correlation test? This calculator provides instant results with a clear step-by-step explanation.
To use this critical value calculator for r, simply follow these steps:
- Enter your sample size (n)
- Enter the significance level (α)
- Click Calculate
The calculator will display left-tailed, right-tailed, and two-tailed critical values for r. It also provides a step-by-step explanation to help you learn how to find the critical values manually.
What is the R Critical Value?
The r critical value, often denoted as rc, is the cutoff value that is used to determine whether Pearson’s correlation coefficient is statistically significant. In particular, it helps you determine whether to reject the null hypothesis or not.
Here’s how you can make decisions regarding your hypothesis using the r critical value, rc
- Reject the null hypothesis if the absolute value of Pearson’s correlation coefficient (r) is greater than the r critical value (rc). In this case, you conclude that the correlation is statistically significant.
- Fail to reject the null hypothesis if the absolute value of Pearson’s correlation coefficient (r) is less than the r critical value (rc). In this case, you conclude that the correlation is not statistically significant.
How to Calculate the R Critical Value by Hand
The r critical value formula is: rc =√[t2/(t2+df)]
Where:
- rc is the r critical value
- t is the absolute t-critical value from the t-table
- df is the degrees of freedom = n-2
Therefore, to compute the r critical value, you need to find the parameters, t and df. Just follow these examples to learn how to compute r critical values for right-tailed, left-tailed, and two-tailed tests using the formula.
Note. You can also look up the critical values from the r critical value table.
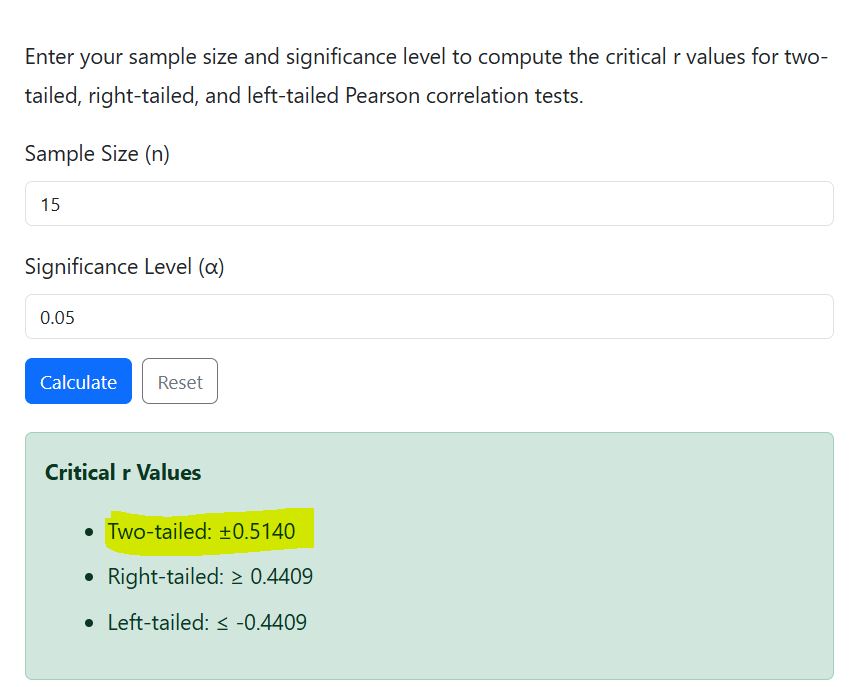
Example 1. Two-Tailed Test
A researcher has a sample of n = 15 and wants to test the significance of the correlation at α = 0.05 (two-tailed test). Compute the r critical value.
Solution
You should use a two-tailed test in correlation if you’re testing the hypotheses:
H0: ρ = 0 (no significant correlation)
H1: ρ ≠ 0 (there is a significant correlation)
Step 1. Identify the parameters
From the question, n = 15. Thus, df = n-2
= 15-2
= 13
The significance level is α = 0.05
Step 2: Find the two-tailed t-critical value for the test
Using the t-distribution table, t0.05/2, 13 = 2.160
Tip. You can also find this value using the t-critical value calculator.
Step 3: Apply the r critical value formula.
By definition, rc =√[t2/(t2+df)]
Substituting the values in the formula gives:
rc =√[2.1602/(2.1602+13)]
=√[4.6656/(4.6656+13)]
=√(0.2641)
=0.5139
Therefore, the two-tailed r critical value for the test is ±0.5139.
Note. You should reject the null hypothesis if the absolute value of Pearson’s correlation is greater than 0.5139. Otherwise, do not reject the null hypothesis.
Using the calculator, you’ll still get similar results, as shown below.
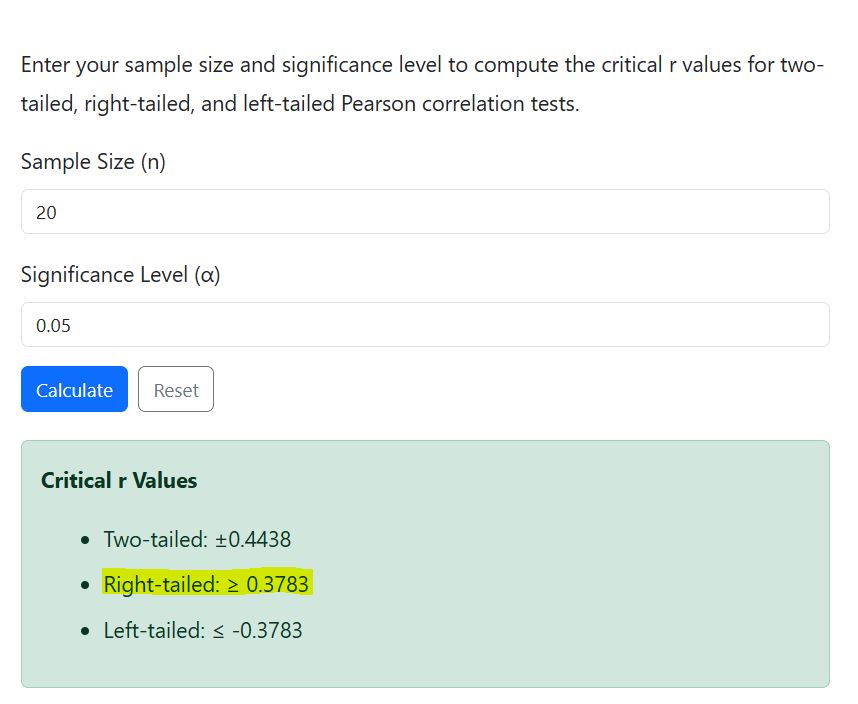
Example 2: Right-Tailed Test (Positive Correlation)
A sample of n = 20 is collected, and the researcher wants to test for a positive correlation at α = 0.05. Compute the r critical value.
Solution
You should use the right-tailed test in correlation if you’re testing the hypotheses:
H0: ρ = 0 (no significant positive correlation)
H1: ρ > 0 (there is a significant positive correlation)
Step 1. Identify the parameters
From the question, n = 20. Thus, df = n-2
= 20-2
= 18
The significance level is α = 0.05
Step 2: Find the right-tailed t-critical value for the test
Using the t-distribution table, t0.05, 18 = 1.734
Step 3: Apply the r critical value formula.
By definition, rc =√[t2/(t2+df)]
Substituting the values in the formula, we have:
rc =√[1.7342/(1.7342+18)]
=√[3.0068/(3.0068+18)]
=√(0.1431)
=0.3783
Therefore, the right-tailed r critical value for the test is 0.3783.
This means that you should reject the null hypothesis if Pearson’s correlation coefficient (r) is greater than 0.3783. Otherwise, do not reject the null hypothesis.
The calculator also yields similar results, as shown below
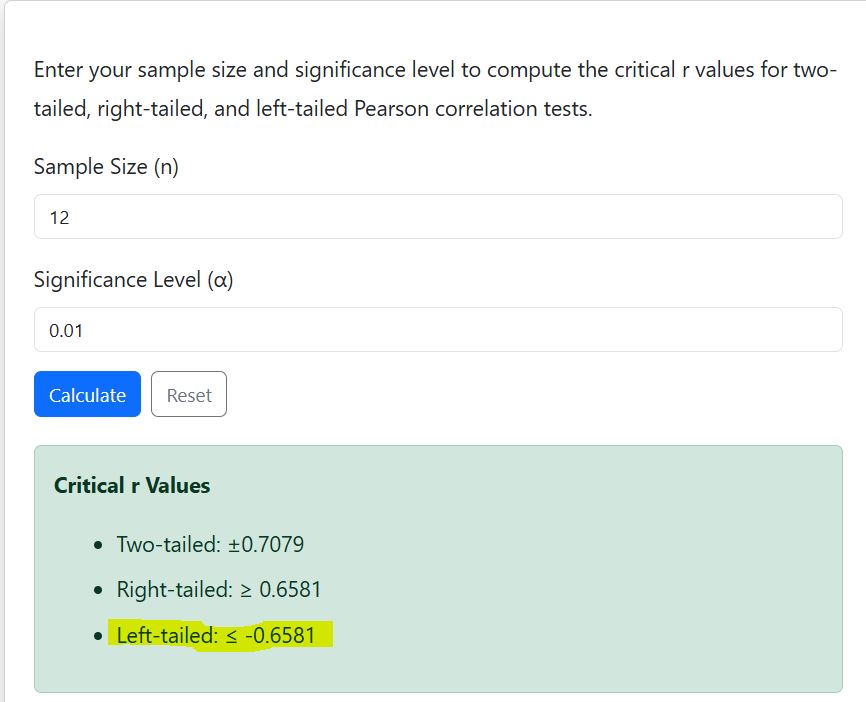
Example 3: Left-Tailed Test (Negative Correlation)
A sample of n = 12 is collected, and the researcher wants to test for a negative correlation at α = 0.01. Compute the r critical value.
Solution
You should use the left-tailed test if you’re testing the hypotheses:
H0: ρ = 0 (no significant negative correlation)
H1: ρ < 0 (there is a significant negative correlation)
Step 1. Identify the parameters
From the question, n = 12. Thus, df = n-2
= 12-2
= 10
The significance level is α = 0.01
Step 2: Find the right-tailed t-critical value for the test
Using the t-distribution table, t0.01, 10 = -2.764
Step 3: Apply the r critical value formula.
By definition, rc =√[t2/(t2+df)]
Substituting the values in the formula, we have:
rc =√[2.7642/(2.7642+10)]
=√[7.6397/(7.6397+10)]
=√(0.4331)
=0.6581
Therefore, the left-tailed r critical value for the test is -0.6581.
This means that you should reject the null hypothesis if Pearson’s correlation coefficient (r) is less than -0.6581. Otherwise, do not reject the null hypothesis.
The figure below shows that the online calculator also yields similar results.
Frequently Asked Questions
The r critical value is the cutoff value used to determine whether a Pearson correlation coefficient (r) is statistically significant. If the absolute value of the computed r is equal to or exceeds the absolute value of critical r, the correlation is significant.
The formula for calculating the critical value of r is: rc =√[t2/(t2+df)]
Where:
– t is the absolute value of the t critical value from the t-distribution table.
– df is the degrees of freedom (n − 2).
A two-tailed test tests for significance in both directions (positive or negative correlation). On the other hand, a one-tailed test tests for significance in only one direction (positive or negative correlation).
No. The calculator automatically finds the t critical values from the t-distribution and converts them to r critical values. You only need to enter your sample size (n) and significance level (α).
Yes. This calculator works for any sample size ≥ 3, as degrees of freedom are calculated as n − 2. For very small samples, be careful to check the t-distribution table for accurate t critical values.