A chi-square table (χ² table), also known as a chi-square critical value table or chi-square distribution table, is a statistical reference table used to determine critical values for chi-square (χ²) tests. These critical values are essential in hypothesis testing to help you determine whether to reject or fail to reject the null hypothesis. Specifically, you compare the chi-square test statistic value with the chi-square critical value to determine whether to reject the null hypothesis. The decision is as follows:
- Reject the null hypothesis if the chi-square test statistic is greater than the χ² critical value
- Fail to reject the null hypothesis if the chi-square test statistic is less than the χ² critical value
Note. You’ll also need the chi-square critical value when constructing confidence intervals for population variance.
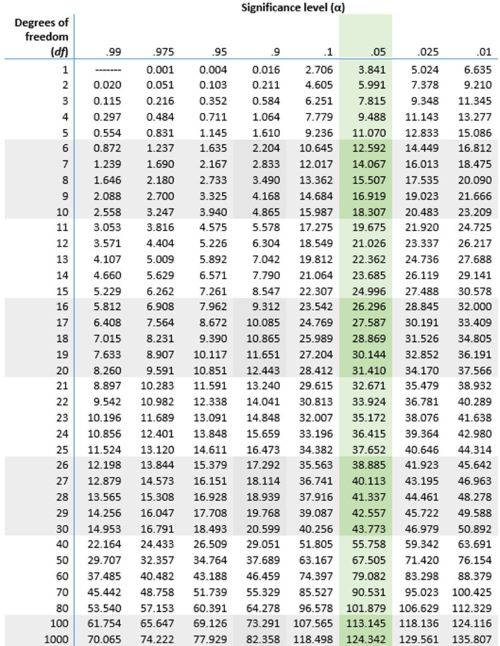
Chi-Square (χ²) Distribution Table
Use the chi-square table below to quickly find the appropriate critical value for your level of significance and degrees of freedom.
Do you prefer working with the table locally? Download the chi-square table in PDF format below.
Need a quick way to find the chi-square critical values? Use the chi-square critical value calculator.
How to Use the Chi-Square (χ²) Table
To find a critical value using the χ² table, follow these steps:
Step 1. Determine the correct degrees of freedom
For a chi-square goodness of fit:
Degrees of freedom, df = k-1, where k is the number of categories
For the chi-square test of independence and the chi-square test of homogeneity:
Degrees of freedom, df = (r-1) * (c-1)
Where:
- r is the number of rows in the contingency table
- c is the number of columns in the contingency table.
Step 2. Choose the appropriate significance level
The significance level represents the probability of rejecting the null hypothesis when it is actually true (Type I error). Common significance levels include:
- α = 0.10 for the 90% confidence level
- α = 0.05 for the 95% confidence level
- α = 0.01 for the 99% confidence level
Step 3. Find the row corresponding to the degrees of freedom
Step 4. Find the column corresponding to your significance level (α)
Step 5. Locate the intersection of row and column to get the chi-square critical value.
Example
Suppose a researcher performs a chi-square test of independence using a 3 × 4 contingency table and wants to test at the 5% significance level. Find the appropriate critical value for the test.
Solution
Step 1. Determine the degrees of freedom
Since this is a chi-square test of independence, with 3 rows and 4 columns, we can calculate the degrees of freedom as follows.
Degrees of freedom, df = (r-1) * (k-1)
= (3-1) * (4-1)
=6
Thus, df = 6
Step 2. Choose the significance level
The researcher is testing the hypothesis at 5% significance level. Thus, the significance level is α=0.05.
Step 3. From the table, identify the row corresponding to df = 6
Step 4. From the table, identify the column corresponding to α=0.05.
Step 5. Find the critical value by looking for the intersection between df = 6 and α=0.05.
Using the table, the value at the intersection is 12.592 as shown below.
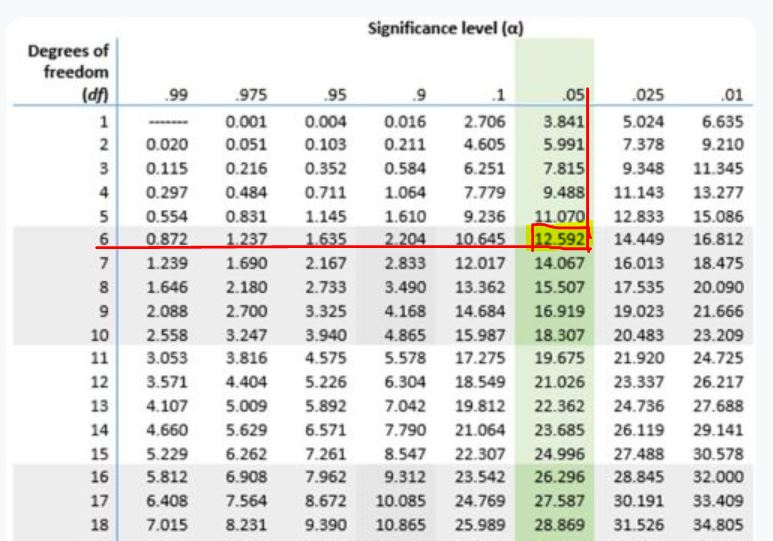
Therefore, the chi-square critical value for the test is χ²critical= 12.592
Final Decision Rule
- If the calculated chi-square statistic is greater than 12.592, reject the null hypothesis.
- If it is less than or equal to 12.592, fail to reject the null hypothesis.