
A 5-number summary is a simple way to describe a dataset using 5-key statistics: the Minimum, First Quartile (Q1), Median (Q2), Third Quartile (Q3), and Maximum. Summarizing your data using the 5-number summary allows you to quickly assess how the data is spread. As a result, you can easily uncover hidden patterns, detect unusual values, and identify the shape and skewness of the data. Given the criticality of these five important statistics, everybody needs to learn how to compute them, either manually or using an online 5-number summary calculator. In this article, you’ll learn how to find the five-number summary in statistics and how to visualize these numbers in a box plot.
How to Find the Five-Number Summary by Hand
Are you struggling with computing the 5-number summary statistics for your data? You’re in the right place! Finding these five key statistics is as simple as ABC.
Here’s how you can find the five-number summary by hand:
- Step 1. Arrange all your data points in ascending or descending order.
- Step 2. Identify the smallest number in the dataset to get the Minimum
- Step 3. Identify the largest number in the dataset to get the Maximum
- Step 4. Locate the middle value in the dataset to get the Median (Q2). However, if the number of observations in the dataset is even, the median is the average of the two middle data points.
- Step 5. Find the first quartile (Q1). This is the median of the lower half of the data. Therefore, to find Q1, divide the ordered data into two halves and locate the middle value of the lower half.
- Step 6. Find the third quartile (Q3). This is the median of the upper half of the data. Therefore, to find Q3, divide the ordered data into two halves and locate the middle value of the upper half.
Example 1: Odd Number of Observations
Problem: The following dataset shows the number of hours studied by 9 students before an exam: 6, 3, 8, 5, 10, 4, 7, 9, 6. Find the five-number summary.
Step 1. Arrange the data in ascending order
The ordered data is: 3, 4, 5, 6, 6, 7, 8, 9, 10
There are 9 observations (odd).
Step 2. Identify the Minimum
Minimum=3
Step 3. Identify the Maximum
Maximum=10
Step 4. Find the Median (Q2)
Since the number of observations is odd, the median is the middle value.
Therefore, median (Q2) = 6
Step 5. Find the First Quartile (Q1)
The lower half of the data (excluding the median) is: 3,4,5,6
Therefore, to find Q1, find the median of this lower half.
Median of the lower half, Q1 = (4+5)/2
= 4.5
Hence, Q1=4.5
Step 6. Find the Third Quartile (Q3)
The upper half of the data (excluding the median) is 7, 8, 9, 10
To get Q3, find the median of this upper half.
Therefore, Q3 = (8+9)/2
=8.5
That is, Q3 = 8.5
Therefore, the 5-number summary of the given odd data is:
Minimum = 3, Q1 = 4.5, Median (Q2) = 6, Q3 = 8.5, Maximum = 10
Example 2: Even Number of Observations
Problem: The following dataset represents the test scores of 10 students: 72, 65, 80, 75, 90, 68, 85, 78, 70, 82. Find the five-number summary.
Step 1. Arrange the data in ascending order
65, 68, 70, 72, 75, 78, 80, 82, 85, 90
There are 10 observations (even).
Step 2. Identify the Minimum
Minimum = 65
Step 3. Identify the Maximum
Maximum = 90
Step 4. Find the Median (Q2)
Since the number of observations is even, the median is the average of the two middle values.
Therefore, Q2 = (75+78)/2 = 76.5
Hence, Median (Q2) = 76.5
Step 5. Find the First Quartile (Q1)
The lower half of the data is: 65, 68, 70, 72, 75
The median of the lower half is 70.
Hence, Q1 = 70
Step 6. Find the Third Quartile (Q3)
The upper half of the data is: 78, 80, 82, 85, 90
The median of the upper half is 82.
Hence, Q3 = 82
Therefore, the five-number summary of the even data is:
Minimum = 65, Q1 = 70, Median (Q2) = 76.5, Q3 = 82, Maximum = 90
Box Plot & 5-Number Summary
After computing the 5-number summary, students are often required to represent the five numbers in a box plot. Sometimes, they are given a box plot and asked to extract the five numbers from it.
If you’re working on such a statistics problem, you only need to understand what each part of a box plot represents. The figure below is a box plot showing representing the five numbers.
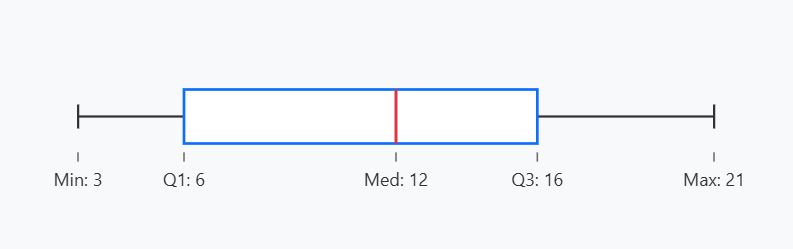
As you can see:
- The left/lower whisker represents the minimum value in the dataset.
- The start of the box on the left represents the lower quartile (Q1)
- The line inside the box is the median (Q2).
- The end of the box on the right represents the third quartile (Q3).
- The right/upper whisker represents the maximum value in the dataset
Ready to explore more insights from your data? Try our descriptive statistics calculator, which gives more insights into the data by providing additional stats like the mean, median, mode, variance, standard deviation, and more.
Frequently Asked Questions
The five numbers are the minimum, first quartile (Q1), median (Q2), third quartile (Q3), and maximum. Together, these numbers summarize the spread and center of a dataset.
– Sort the data either in ascending or descending order
– Identify the minimum and maximum from the sorted data
– Find the median (Q2) by locating the middle value if the number of observations is odd. However, if not, the median is the mean of the two middle values.
– Find the first quartile (Q1), which is the median of the lower half of the ordered data.
– Find the third quartile (Q3), which is the median of the upper half of the ordered data.
Yes. For an odd number of observations, the median is the middle value. For an even number of observations, the median is the average of the two middle values. The process for finding Q1 and Q3 remains the same.
To find Q1 (first quartile) and Q3 (third quartile), first arrange the data in ascending order. Then divide the dataset into two halves.
– Q1 is the median of the lower half of the data.
– Q3 is the median of the upper half of the data.
If a half contains an even number of values, take the average of the two middle values. If it contains an odd number of values, the quartile is the single middle value.
Yes. Q1 and Q3 can be decimals, especially when the lower or upper half of the data contains an even number of values. In this case, the quartile is the average of the two middle numbers.