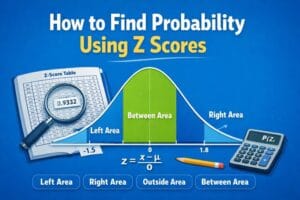
Calculating a z-score is always straightforward. You only need to apply the formula, z =(x−μ)/σ. However, finding probability with a z-score is quite challenging for many students. There are many options for finding probability from a z-score. Some of the ways include an online z-score probability calculator, ti-83/84 z probability calculator, Excel, or z-tables. Z-tables provide the quickest way to find probabilities with z score, especially during proctored exams.
Therefore, in this article, you’ll learn how to find probability with z-scores using positive and negative z-tables. The tutorial covers finding the area to the left of a z score, the area to the right of a z score, the area outside two z scores, and the area between two z scores. Each section provides an exam-style question to help you grasp the concept.
Let’s dive in!
1. Area to the Left of a Z Score
The area to the left of a z-score represents the probability that a normally distributed random variable takes a value less than a given z-score. Symbolically, this is written as P(Z<z).
Since z-tables are designed to find probabilities to the left of a z-score, finding any probability to the left of a z-score is straightforward.
Let’s consider several examples to learn how to find the area to the left of z score
Example 1. The test scores of students follow a standard normal distribution. Find the probability that a randomly selected student has a z-score less than 1.25.
Here, we need to find P(Z<1.25). To find P(z<1.25), you only need to locate 1.25 in the positive z-table.
Reading the value at the intersection of 1.2 (row) and 0.05 (column) gives P(Z<1.25) as 0.89435, as shown below.
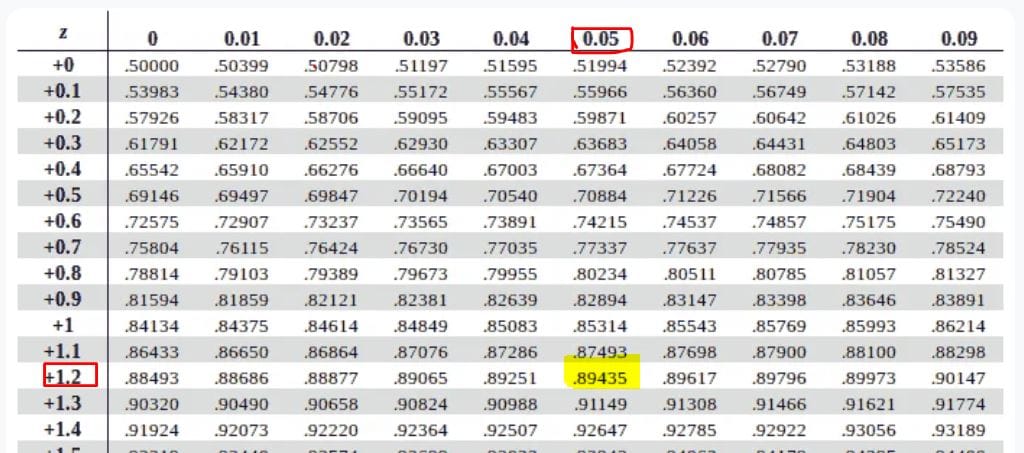
Therefore, the probability that a randomly selected student has a z-score less than 1.25 is approximately 0.8944.
Example 2. The heights of students in a college are normally distributed with a mean of 170 cm and a standard deviation of 8 cm. Find the probability that a randomly selected student is shorter than 160 cm.
In this case, we have raw scores, and we need to first calculate the z-score.
From the question, Mean, μ =170, Standard deviation, σ = 8, x = 160
By definition, z = (x-μ)/σ
= (160-170)/8
= -1.25
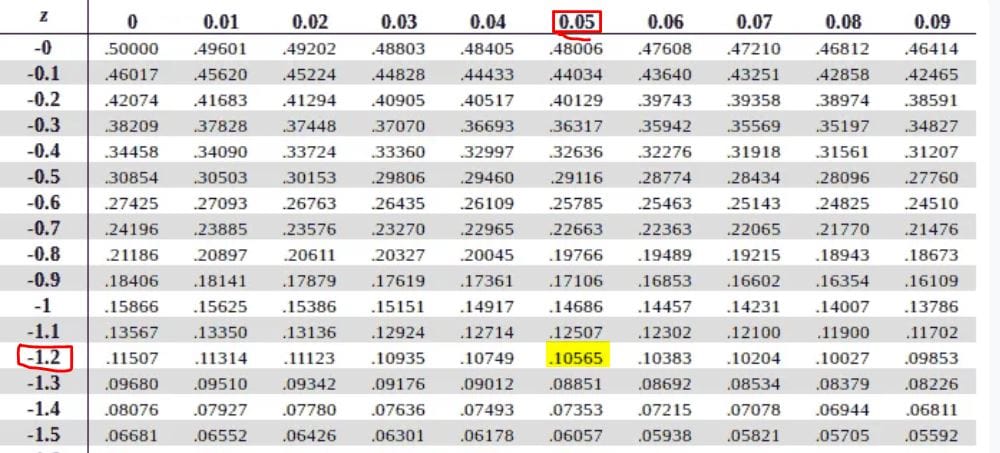
Thus, we need to find P(z<-1.25). To find this probability, we can either use a positive or a negative z-table.
Using a negative z-table, the required probability is the value at the intersection of -1.2 (row) and 0.05 (column). This gives 0.10565 as shown below.
Alternatively, you can use a positive z-table and read P(z<1.25). P(z<-1.25) = 1-P(z<1.25)
Since P(z<1.25) = 0.8944 (from example 1), then P(z<-1.25) = 1-0.8944
=0.1056.
Therefore, the probability that a randomly selected student is shorter than 160 cm is 0.1056.
2. Area to the Right of a Z Score
The area to the right of a z-score represents the probability that a value is greater than a given z-score. This is written as P(Z>z).
Since most z-tables give left-tail probabilities P(Z<z), we use the complement rule.
Thus, P(Z>z) = 1-P(Z<z).
Let’s consider an example
Example 3. Find the probability that a randomly selected observation has a z-score greater than 0.84.
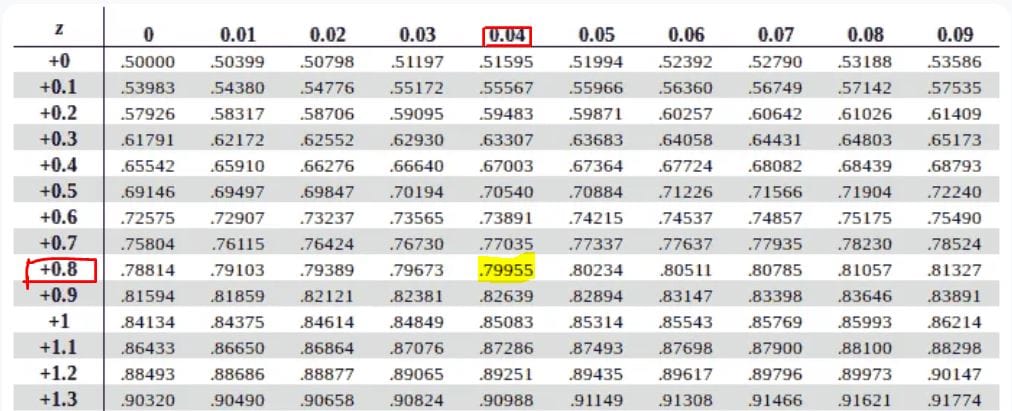
We need to find P(z>0.84). Using a positive z-table, we’ll find P(z< 0.84) by looking up the value at the intersection of 0.8 (row) and 0.04 (column). This gives P(z< 0.84) = 0.79955, as shown below.
Therefore, using the complement rule, P(z> 0.84) = 1-P(z<0.84)
= 1- 0.79955
= 0.20045
As such, the probability that a randomly selected observation has a z-score greater than 0.84 is 0.2005.
3. Area Between Two Z Scores
The area between two z-scores is the probability that a value lies within a specified range. It is often denoted as P(z1<Z<z2).
To find the probability that z lies between two z-scores, follow these steps:
Step 1: Find the area to the left of the upper z-score
Step 2: Find the area to the left of the lower z-score
Step 3: Subtract the smaller area from the larger one
In other words, P(z1<Z<z2) = P(Z<z2)−P(Z<z1)
Example 4. Find the probability that a standard normal random variable lies between −0.85 and 1.40.
Here, we need to find P(-0.85 <z < 1.40).
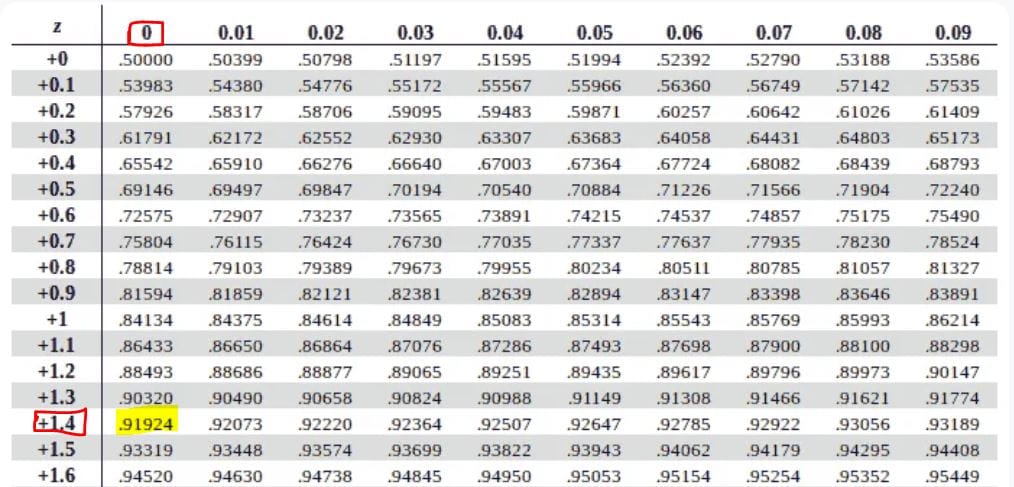
Step 1: Find the area to the left of 1.40. That’s P(z<1.40)
Using a positive z-table, P(z<1.40) = 0.91924, as shown below.
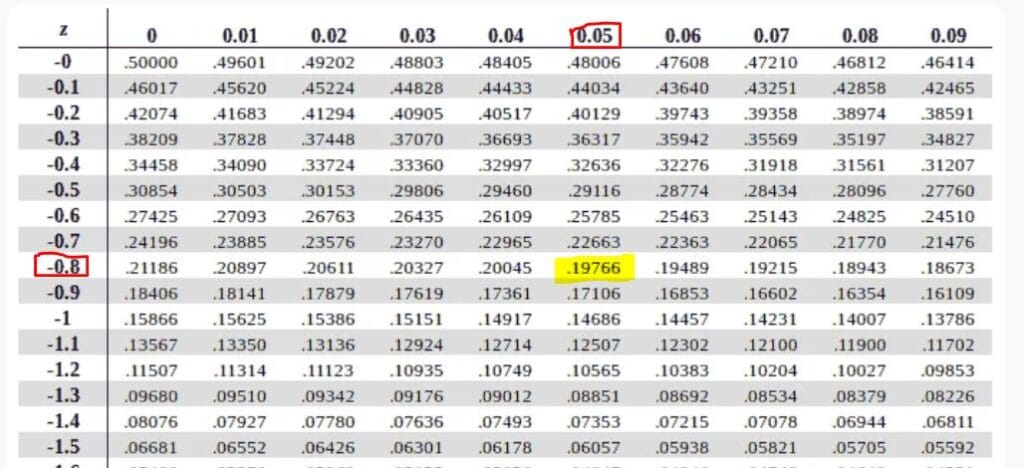
Step 2: Find the area to the left of -0.85. That’s P(z<-0.85)
Using a negative z-table, P(z<-0.85) = 0.19766, as shown below.
Step 3. Subtract the smaller area from the larger area
Therefore, P(-0.85 <z< 1.4) = 0.91924 – 0.19766
=0.72158
Therefore, the probability that a standard normal random variable lies between −0.85 and 1.40 is 0.7216.
4. Area Outside Two Z Scores
The area outside two z-scores is the probability that a value lies below the lower z-score or above the upper z-score. In symbols, this is written as P(Z<z1 or Z>z2)
This situation is common in hypothesis testing, confidence intervals, and outlier detection.
To find the probability outside two z-scores, follow these steps:
Step 1: Find the area to the left of the lower z-score
Step 2: Find the area to the right of the upper z-score
Step 3: Add the two probabilities
In other words, P(Z<z1 or Z>z2) = P(Z<z1)+P(Z>z2)
Example 5. Find the probability that a standard normal random variable lies outside the interval: -1.30 <Z<1.85.
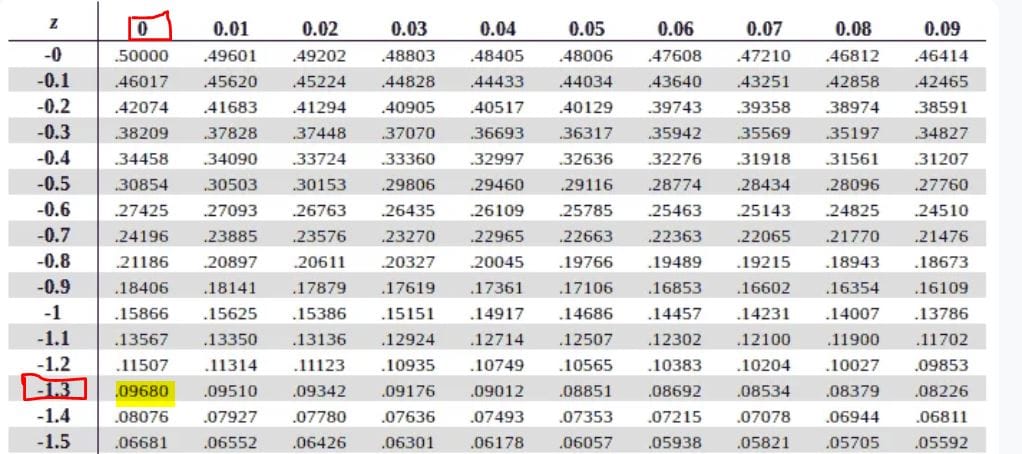
Step 1: Find the area to the left of -1.30
Using a negative z-table, the area to the left of -1.30 is 0.0968, as shown below:
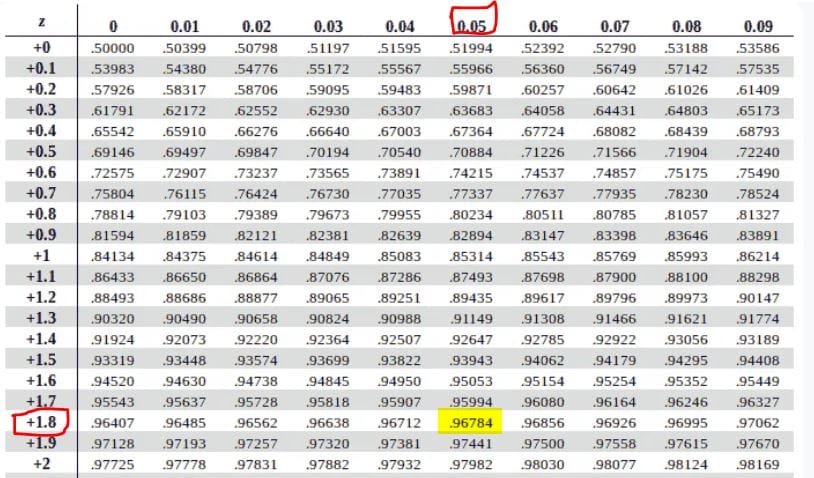
Step 2: Find the area to the right of 1.85
Recall, z-tables give the area to the left of a z-score.
To find the area to the right of 1.85, P(z>1.85), we use the complement rule.
Thus, P(z>1.85) = 1-P(z<1.85)
Using a positive z-table, P(z<1.85) = 0.9678, as shown below.
Therefore, P(z>1.85) = 1-0.9678
= 0.0322
Step 3: Add the two probabilities
We can now compute the probability outside the interval as follows:
P(Z<-1.30 or Z>1.85) = P(Z<-1.30)+P(Z>1.85)
= 0.0322 +0.0968
=0.1290
Therefore, there’s a 12.90% chance that the value lies outside the two z-scores.
Normal Distribution Empirical Rule
The standard normal distribution follows a predictable pattern. In particular, most of the data values are close to the mean, and the probability decreases as you move further away. The most well-known rule that summarizes this pattern is the normal distribution empirical rule, also called the 68–95–99.7 Rule.
This rule states that:
- About 68% of the data fall within 1 standard deviation of the mean. This implies that P(−1<Z<1)=0.6826
- About 95% of the data fall within 2 standard deviations of the mean. This implies that P(−2<Z<2)=0.9544
- About 99.7% of the data fall within 3 standard deviations of the mean. This implies that P(−3<Z<3)=0.9974
Tip: The empirical rule helps you quickly estimate probabilities and identify outliers without using a z-table. For example:
- If a value lies more than 2 standard deviations away from the mean, it’s relatively unusual.
- A value more than 3 standard deviations away is considered rare.
Quick Takeaways: Finding Probability with Z Scores
- Calculating a z-score is straightforward, but converting a z-score into a probability requires careful use of z-tables.
- Z-tables give probabilities to the left of a z-score, P(Z<z). As such, you should manipulate this fact to be able to calculate most z-probability problems.
- To find the area to the left of a z-score, directly read the value from the z-table (or use symmetry for negative z-scores).
- To find the area to the right of a z-score, always use the complement rule: P(Z>z) = 1−P(Z<z)
- To find the area between two z-scores, subtract the smaller left-tail probability from the larger one: P(z1<Z<z2) = P(Z<z2)−P(Z<z1)
- To find the area outside two z-scores, P(Z<z1 or Z>z2), compute both tail probabilities and add them.
- Negative z-scores can be handled using either:
- A negative z-table, or
- A positive z-table with symmetry and the complement rule.
- The 68–95–99.7 empirical rule provides a fast way to estimate probabilities and identify unusual or rare values without using a z-table.
Frequently Asked Questions
A z-score shows how far a data point is from the mean in terms of standard deviations. The probability from a z score represents the area under the standard normal curve. It tells you the likelihood of observing a value less than or greater than a given point.
To find probability from a z score using the z table, locate the row for the first two digits of the z score and the column for the second decimal place. The intersection gives the area (probability) for that z score.
If the z table lists only positive values, use the symmetry of the normal distribution. In this case,
P(Z < -a) = 1 – P(Z < a). However, if the table lists negative values, read the values as is.
The empirical rule (68–95–99.7 rule) summarizes probabilities in a normal distribution. The rule states that:
– About 68% of values fall within 1 standard deviation of the mean.
– About 95% fall within 2 standard deviations of the mean.
– About 99.7% fall within 3 standard deviations of the mean.