
The t-critical value is an essential part of statistics and hypothesis testing. It helps you decide whether your results are significant or just due to chance. Without the t-critical value, it is impossible to make accurate conclusions from small sample data. In this guide, you will learn what a t-critical value is, why it matters in hypothesis tests, and how to find t-critical value from a t-distribution table. You’ll also find alternative methods for calculating t-critical values using an online calculator and excel. Therefore, by the end of this article, you will confidently find any t-critical value (right, left or two-sided).
What Is a T Critical Value?
A t-critical value is a cutoff point on a t-distribution used to determine whether t-test results are statistically significant. It serves as a threshold for comparing the calculated t-statistic from your data. In hypothesis testing, the t-critical value tells you whether or not to reject the null hypothesis. Specifically, we reject the null hypothesis if the absolute value of the t-statistic is greter than the t critical value. Otherwise, we fail to reject the null hypothesis.
In addition to hypothesis testing, t-critical values are used in constructing confidence intervals for population means involving t-tests. In this context, it defines how far the sample mean can vary from the true population mean. For instance, for a given confidence level (such as 95%) and degrees of freedom, the t-critical value is multiplied by the standard error to calculate the margin of error. The resulting margin of error is used to create the confidence interval for the population mean.
T Critical Value Formula
The t-critical value formula helps determine the cutoff point that separates the rejection region from the acceptance region in a t-distribution. It depends on two main factors: the significance level (α) and the degrees of freedom (df). For a one-sample t-test and a paired sample t-test, the degrees of freedom usually equal the sample size minus one (df=n−1). However, for an independent samples t-test, the degrees of freedom are $n_1+n_2-2$.
The t-critical value formula uses the inverse t-distribution function to get the t-value corresponding to a specific probability.
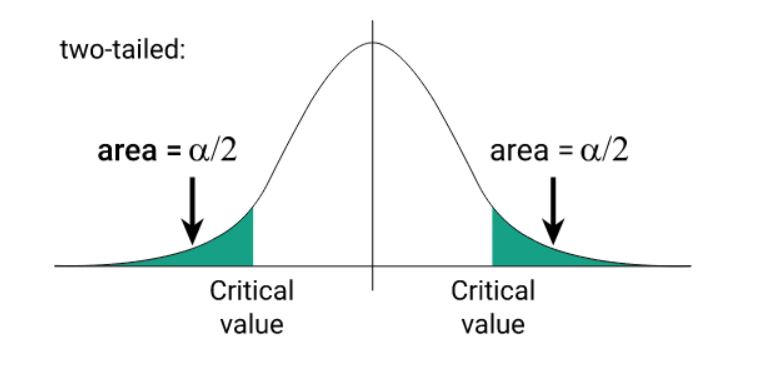
For a two-tailed test, we calculate the t-critical value using half of the significance level, since the area is split equally between both tails of the distribution. Thus, the two-sided t-critical value formula is:
$t_{crit} = t(1 – \frac{\alpha}{2}, df)$
This formula is used when testing whether a sample mean is significantly different (either higher or lower) from a hypothesized mean. Each tail of the distribution contains an area of $\frac{\alpha}{2}$.
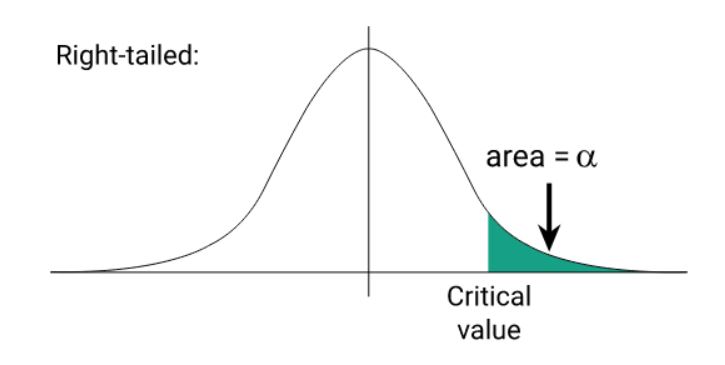
For a right-tailed test, we calculate the t-critical value using the formula:
$t_{crit} = t(1 – \alpha, df)$
We use the right-tailed t critical value when testing the hypothesis that the sample mean is greater than the hypothesized mean. In this case, the shaded region lies in the right tail of the distribution as shown below:
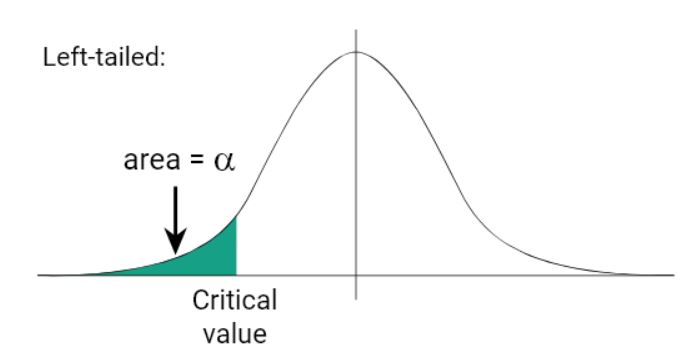
For a left-tailed test, we compute the t-critical value using the formula:
$t_{crit} = t(\alpha, df)$
In this case, we want to test the hypothesis that the sample mean is less than the hypothesized mean. The rejection region lies in the left tail, and the area under this tail equals to α as follows:
How to Find T Critical Value
Finding a t critical value from a t distribution table involves three key pieces of information
- Whether the test is one-tailed or two-tailed
- The significance level (α)
- The degrees of freedom (df)
Once you have this information, you can determine the t-critical value using one of the following methods:
1. Using a t-Distribution Table (by Hand)
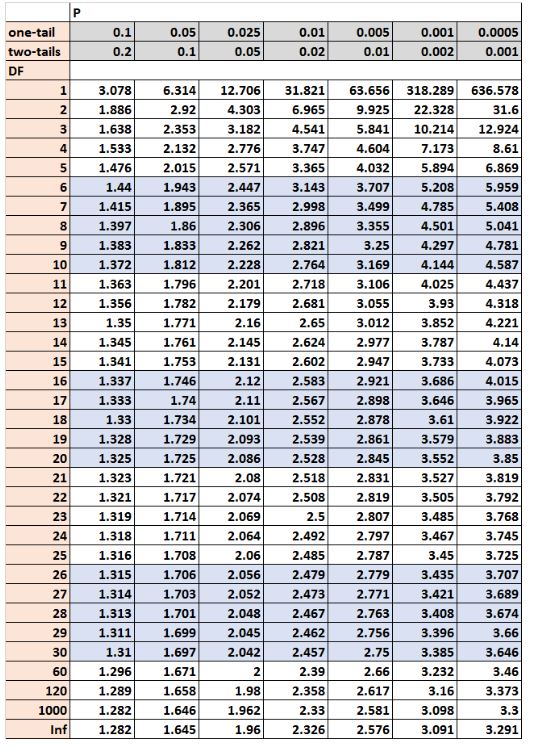
The t-distribution table method is the traditional and most reliable method for finding t-critical values. Using this method, the t critical value is simply the point where the corresponding df row and α column intersect in the t distribution table (see Figure 1).
Therefore, to find the t critical value from the t-distribution table, you need to follow these steps:
- Decide whether the test is one-tailed or two-tailed. If your alternative hypothesis points in one direction (e.g., mean > 0 or mean < 0), use a one-tailed α. However, if it can go either way (e.g., mean ≠ 0), use a two-tailed α.
- Choose the correct α. For a two-tailed test with overall α = 0.05, you can either use table column for two-tailed α = 0.05 or divide α by 2 and use the one-tailed α = 0.025 (because 0.05/2 = 0.025).
- Compute degrees of freedom (df). Identify the degrees of freedom corresponding to the statistical test you’re performing. Some common degrees of freedom formulas are:
- One-sample or paired t test: df = n − 1.
- Independent samples (pooled / equal variances): df = n₁ + n₂ − 2.
- Find the intersection in the table. Locate the row for your df and the column for the correct α (or the two-tailed α row). The number at their intersection is the t critical value.
- Compare and decide. In this case, the decision to reject the null hypothesis is as follows:
- For right-tailed tests, reject H₀ if t_calculated ≥ t_critical.
- For left-tailed tests, reject H₀ if t_calculated ≤ −t_critical.
- For two-tailed tests, reject H₀ if |t_calculated| ≥ t_critical.
2. Using an Online Calculator
For a quick and efficient way to find t-critical values, you can use an online t-critical value calculator. You only need to enter the significance level (α) and degrees of freedom (df). The calculator automatically provides t-critical values for two-tailed, right-tailed, and left-tailed tests. For example, with α = 0.05 and df = 20, it gives:
- Two-tailed: ±2.086
- Right-tailed: 1.7247
- Left-tailed: -1.7247
Additionally, this online tool is efficient because it also shows a step-by-step explanation. It even explains how to interpret these values for hypothesis testing.
3. Using Excel
You can also find t-critical values quickly using Excel. With functions like T.INV for one-tailed tests or T.INV.2T for two-tailed tests, Excel calculates the exact t-critical value in seconds. You only need to enter the right formula and specify your significance level (α) and degrees of freedom (df). On hitting the enter button on the keyboard, the formula will return the appropriate critical value.
While the excel method is fast, it becomes tedious since you’ll have to type the formula and specify df, and alpha every time. To gain comprehensive understanding of how this strategy works with examples, check out our detailed Excel t-critical value guide
Finding T-Critical Values by Hand: Examples
Below are three worked examples showing how to find t critical values for right-tailed, left-tailed, and two-tailed tests using a t distribution table.
Example 1: Right-tailed Test
A psychologist wants to see if a new therapy improves happiness scores above a baseline of 50. She tests 20 participants and sets a significance level of α = 0.05. Find the appropriate critical value for this hypothesis test.
We can calculate the critical value from t distribution table as follows:
- Identify the type of test: In this case, it is a one-tailed (right-sided) test.
- Identify the significance level: Since the test is one-tailed, we use α = 0.05.
- Identify the degrees of freedom: n-1 = 20-1 = 19
- Locate the intersection of α = 0.05 (one-sided) and 19 degrees of freedom. From the table, t₀.₀₅,₁₉ = 1.729.
- If t_calculated ≥ 1.729 → Reject H₀. Otherwise, we fail to reject H₀.
Example 2: Left-tailed Test
A smartphone manufacturer claims its battery lasts 15 hours, but a consumer group suspects it lasts less. They test 10 phones with α = 0.05. Determine the appropriate critical value to test the hypothesis.
To find the left-tailed t-critical value, follow these steps:
- Identify the type of test: Left-tailed (one-tailed).
- Identify the level of significance: We use α = 0.05.
- Determine the degrees of freedom: df = n-1 = 10-1 = 9
- From the t-distribution table, locate the intersection of df=9 and one-tailed α = 0.05. This gives, t₀.₀₅,₉ = 1.833.
- The decision rule in this case is:
- If t_calculated ≤ −1.833 → Reject H₀. Otherwise, we fail to reject the null hypothesis.
Example 3: Two-tailed Test
A nutritionist tests whether a new supplement affects average cholesterol levels, which could increase or decrease. She tests 16 participants with α = 0.05. Find the appropriate critical values for this test.
We can compute the two-tailed t-critical value as follows:
- Identify the type of test: Two-tailed test
- Divide α by 2: 0.05 ÷ 2 = 0.025 and use the one-tailed column when α = 0.025.
- Determine the degrees of freedom: df = n-1 = 16-1 = 15
- From the t-distribution table, we locate the intersection of df = 15 and α = 0.025, which gives t₀.₀₂₅,₁₅ = 2.131.
- The decision rule is to reject the null hypothesis if the absolute value of t_calculated is greater than the absolute value of t-critical.
Conclusion
The t-critical value is an important part of hypothesis testing. It helps you decide whether your results are statistically significant or due to chance. You can find t-critical values using a t-distribution table, an online calculator, or Excel. Using the t-table by hand helps you understand how the value is determined, while calculators and Excel make the process faster and easier. By practicing with examples for right-tailed, left-tailed, and two-tailed tests, you can confidently find t-critical values for any test. Remember, knowing the t-critical value is key to making accurate conclusions in research and statistics.
Frequently Asked Questions
A t-critical value is the threshold from the t-distribution used in hypothesis testing. It helps determine whether the results of a t-test are statistically significant based on your sample size and significance level.
You can find it using a t-distribution table, an online t-critical value calculator, or Excel. However, to find accurate results, you need to know the significance level (α), degrees of freedom (df), and whether the test is one-tailed or two-tailed.
The t-critical value is the cutoff from the t-distribution. The t-statistic is calculated from your sample data. If the absolute value of the t-statistic exceeds the absolute t-critical value, you can reject the null hypothesis.
When using a t-distribution table, the approach depends on whether your test is one-tailed or two-tailed:
– One-tailed test: Look up the critical value using the significance level (α) directly.
– Two-tailed test: Divide the significance level (α) by 2 (unless your table already shows two-tailed values) and use that value to find the critical value for each tail.
This method ensures you select the correct t-critical value for your specific test type.
Degrees of freedom adjust the shape of the t-distribution according to your sample size. Smaller samples result in larger critical values, reflecting more variability.