
In statistics, a z-score is a standard score that indicates how many standard deviations a data point is from the mean. For instance, a z value of -2 means that the data point is 2 standard deviations below the mean.
To find the z-score value manually, we use the following formula:
z=(x−μ)/σ
Where
- z is the z-score (standard score)
- x is the raw data point
- μ is the mean
- σ is the standard deviation
Besides applying the formula manually, you can also use a single z-score value calculator, especially when you want to convert a single data point to a standard score. However, for a set of data values, calculating all the z scores manually can be tiresome. In this case, you need to use technology such as Excel, R, SPSS, etc. In this article, we’ll walk you through how to find z-score values using Excel.
How to Calculate Z-Score Using Excel: Step-by-Step
Finding z-score values in Excel is easy and quick. You can either find the value manually by applying the z-score formula or using the STANDARDIZE function.
Method 1: Manual Z-Score Formula Approach
To calculate the z-score in Excel using the z-score formula, follow these steps:
- Calculate the mean of the dataset. To find the mean of the dataset in Excel, you simply type the formula
=AVERAGE(YourDataRange)in an empty cell and click Enter. Check out the comprehensive guide on computing the sample mean in Excel for more details. - Calculate Standard Deviation. To calculate the standard deviation in Excel, type the formula
=STDEV.S(YourDataRange)(for sample data) or=STDEV.P(YourDataRange)(for population data) and click the Enter key. - Apply the Z-score formula. In a new column next to your data, use
=(B2 - $MeanCell) / $StdDevCell. ReplaceB2with your first data point, andMeanCell/StdDevCellwith the cells containing your calculated mean and standard deviation. Note. You should add a dollar sign after clicking the cells with your mean and standard deviation to lock them. - Copy the formula down the column. You do this by double-clicking on the small square (fill handle) at the bottom-right of the formula cell.
By clearly following the 4 steps, you’ll find z-score values for both sample and population data. To help you grasp the concepts, let’s walk you through an example.
Example 1. Finding Z-Score in Excel using Manual Formula Method
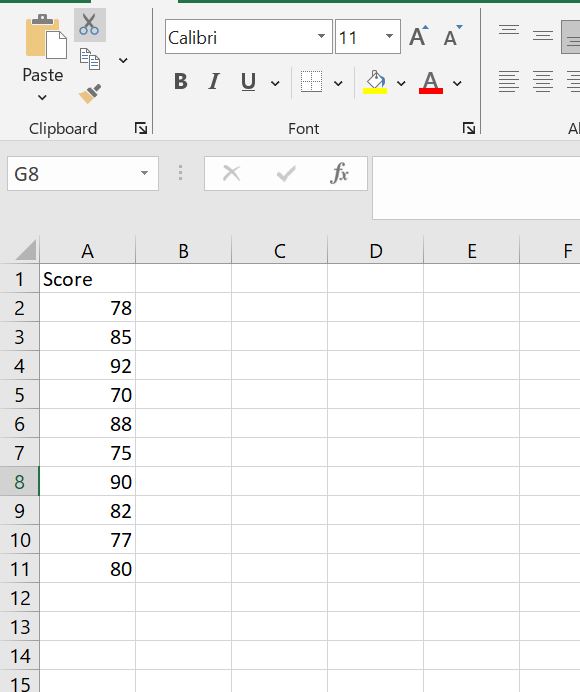
Consider the following data consisting of marks scored by 10 students in a math exam.
Data: 78, 85, 92, 70, 88, 75,90, 82, 77, 80
To find the corresponding z-scores using Excel, follow these steps:
Step 1: Enter the data in cells A2:A11 (see below)
Step 2: Calculate the Mean of the Dataset.
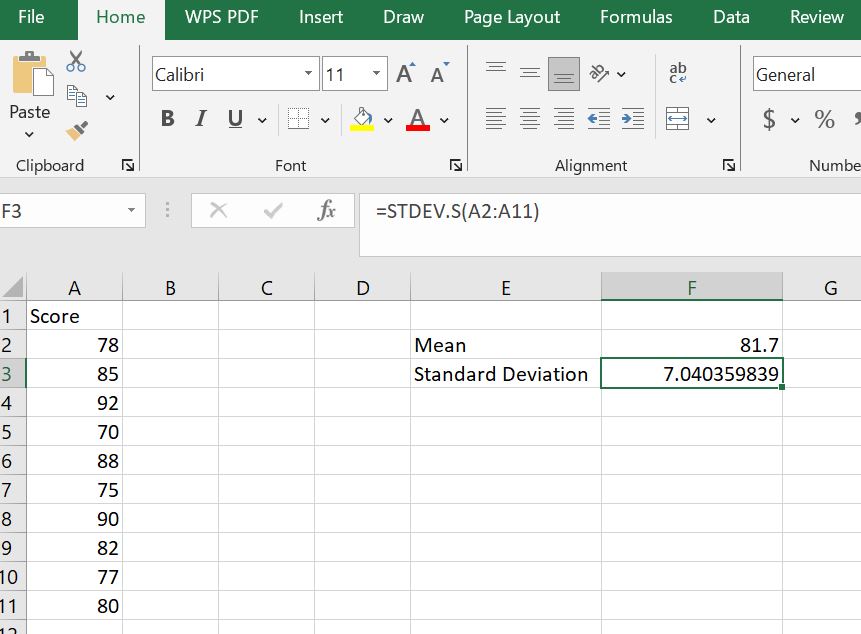
To find the mean of the data, type the formula =AVERAGE(A2:A11) in cell F2 and press Enter. Label the result as “Mean” in cell E2. The sample mean will be 81.70.

Note. A2:A11 refers to the cells containing your data. You can simply select the cells containing the data directly instead of typing the range.
Step 3: Find the Standard Deviation of the Dataset
Since the data is from a sample, we use the sample standard deviation function, =STDEV.S().
Therefore, to find the sample standard deviation, type the formula: =STDEV.S(A2:A11) in cell F3 and press Enter. Label it in cell E3 as “standard deviation”. This sample standard deviation will be 7.04.
Step 4: Apply the z-score formula to calculate the Z-score for the first value
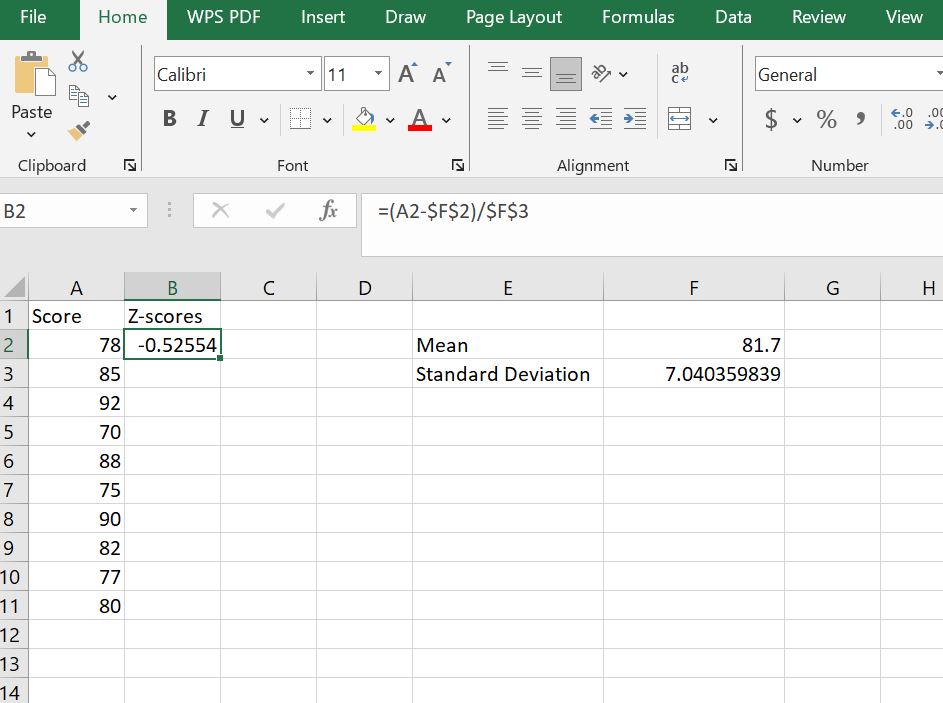
To find the z score for the first value in the dataset (x = 78), type the formula: =(A2 - $F$2)/$F$3 in cell B2 and click Enter. The z-score for the first value will be -0.5255.
Note.
In the formula =(A2 - $F$2)/$F$3
- A2 is the cell with the first data point
- F2 is the cell containing the mean
- F3 is the cell containing the sample standard deviation
Therefore, if you used different columns or rows, remember to change the cell references accordingly.
The dollar signs ($) in $F$2 and $F$3 makes the cell reference absolute. As such, when you copy the formula down the column, Excel will always refer to these specific cells for the mean and standard deviation.
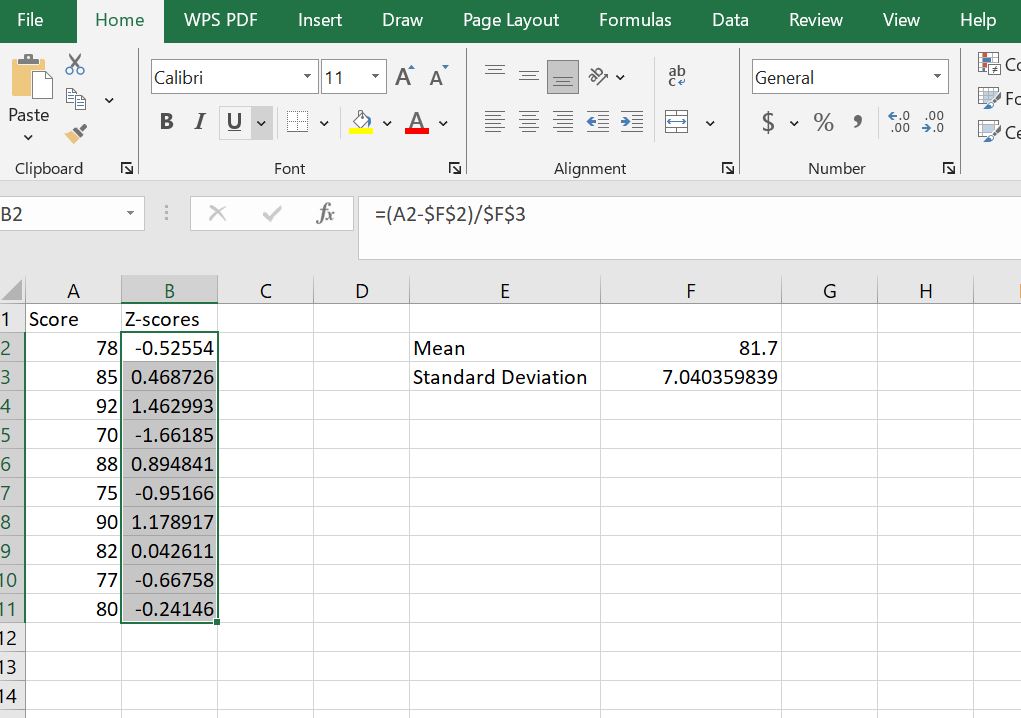
Step 4: Copy the formula down the column to find the z-scores for the other data points
Here, drag the fill hand down till it coincides with the last data point in the data and release. The full column (B2:B11) should have the z-scores for all the data points.
Method 2. Using the STANDARDIZE() Function
This is the recommended method for computing z-scores in Excel. The steps are similar to the manual approach, with the only difference being the use of the standardize() function instead of manually applying the z-score formula.
Therefore, to find z score in Excel using the standardize() function, follow these steps:
- Calculate the mean of the data (if not given)
- Calculate the standard deviation of the data
- Type the formula,
=STANDARDIZE(X, Mean, Standard_dev)in your preferred cell and click enter. In the formula, x is the cell containing the specific data point you want compute z score for. Mean is the cell containing either the sample or population mean, and standard_dev is the cell containing either the sample or population standard deviation. - Copy the formula to fill in the full column with z-score values.
Example 2. Calculating z-scores using the standardize() Function in Excel
To help you learn how to compute z-scores using the standardize() function, we’ll use the same dataset (example 1). Assuming you’ve already entered the data in cells A2:A11, you can easily find the z scores by following these steps:
Step 1: Set Up the Z-Score Column
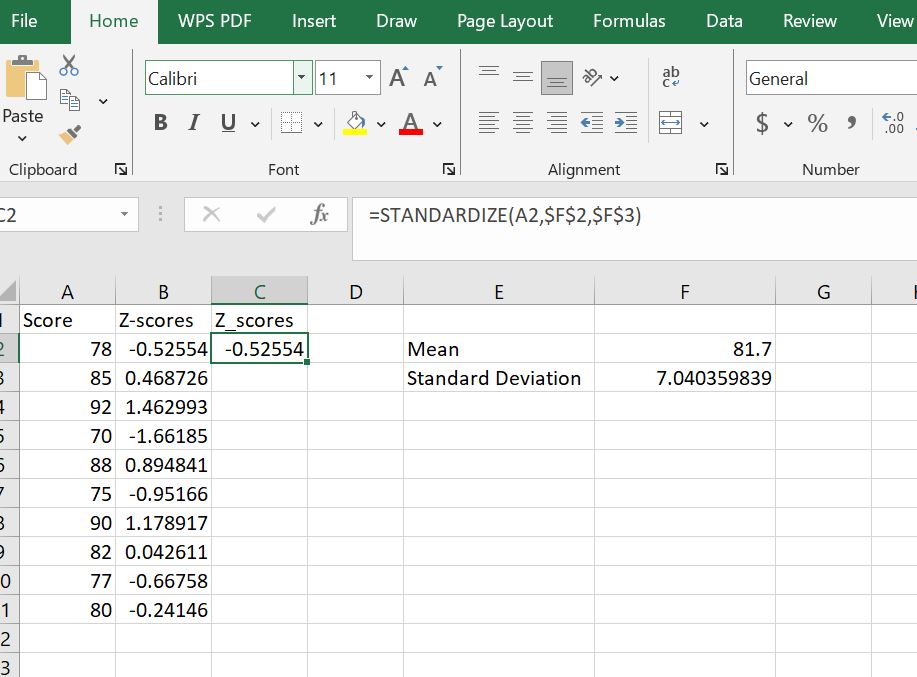
Create a new column next to your scores to store the standardized results. In cell C1, type Z_Scores to store the results from the STANDARDIZE() function.

Step 2: Apply the STANDARDIZE Function
In cell C2, type the formula: =STANDARDIZE(A2, $F$2, $F$3) and press Enter to calculate the z-score for the first student. As you can see, the formula gives similar results to the manual method. That is, z = -0.5255 (for a student with a score of 78).
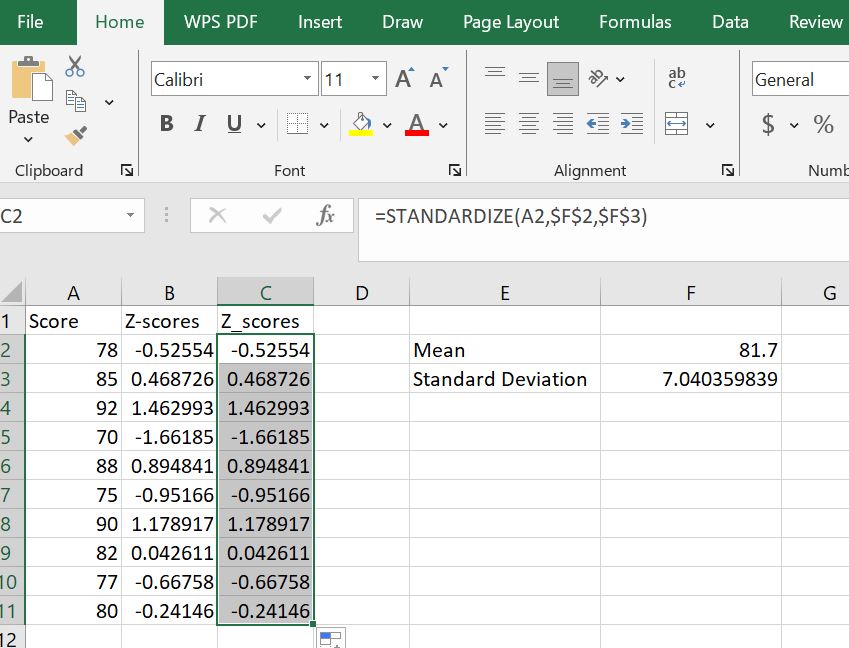
Step 3: Copy the Formula to fill in the column
To fill the full column with z-scores corresponding to the raw scores, drag the fill handle from C2 down to C11. As you can see, the z-scores in columns B and C are identical.
Key Takeaways: How to Calculate Z-Score in Excel
You can calculate a z-score in Excel in two simple ways: using the manual formula or the STANDARDIZE() function.
To calculate z score in Excel using the manual z-score formula, follow these steps:
- Calculate the mean using
=AVERAGE(data_range) - Calculate the standard deviation. Use
=STDEV.S(data_range)for sample data or=STDEV.P(data_range)for population data - Apply the z-score formula:
=(X - MeanCell) / StdDevCell - Lock the mean and standard deviation cells with $ and copy the formula down.
Alternatively, if you want to use the standardize() function, follow these steps:
- Calculate the mean and standard deviation (if not already given).
- Use the formula:
=STANDARDIZE(X, MeanCell, StdDevCell) - Copy the formula down to compute z-scores for all values.