This calculator computes the p-value from the chi-square statistic value. Simply enter the chi-square test statistic value, the degrees of freedom, and click the “Calculate” button to get instant results.
Need help making the correct decision about your hypothesis? Just specify the significance level (α) and click the “Get Decision” button. The calculator will instantly tell you whether to reject or fail to reject the null hypothesis.
Chi-Square P-Value Calculator
Hypothesis TestingEnter your chi-square statistic, degrees of freedom, and significance level to calculate the upper-tail p-value and decision.
Step-by-step explanation
Want to make decisions using the critical value approach? Use the chi-square critical value calculator instead.
How to Use the Chi-Square to P-value Calculator
Want to find the p-value from the calculated chi-square test statistic value? With this free calculator, you don’t need to use the chi-square critical value table. Just follow these simple steps:
- Enter the chi-square test statistic value
- Enter the degrees of freedom for your chi-square test
- Click the “calculate” button
The calculator will instantly display the correct p-value for your chi-square test. It works for all chi-square tests (chi-square test of independence, chi-square goodness of fit, and chi-square test of homogeneity), as long as you enter the correct degrees of freedom.
Additionally, if you don’t know how to make a decision based on the p-value, the calculator can help you with this. You only need to specify your significance level and click the optional “Get Decision” button. The calculator will tell you whether to reject or fail to reject the null hypothesis.
What is the P-value in a Chi-Square Test?
In a chi-square test, the p-value is the probability of obtaining a chi-square test statistic value that is as large as or larger than the observed value, assuming the null hypothesis (H0) is true. It allows you to determine whether the results from the chi-square test are significant or not.
Here’s how to make decisions regarding your hypothesis using the p-value:
- Reject the null hypothesis (H0) if the p-value is less than the significance level (α).
- Fail to reject the null hypothesis (H0) if the p-value is greater than the significance level (α).
When to Use a Chi-Square Test
A chi-square test is commonly used when you want to determine whether there are significant relationships between categorical variables. This means the test only works for frequency/count data rather than continuous measurements.
There are three common types of chi-square tests, which are:
- Chi-square test of independence. It tests the relationship between two categorical variables (e.g., gender & voting preference)
- Chi-square goodness of fit. It tests whether observed frequencies follow the expected distribution.
- Chi-square test of homogeneity. It compares the distribution of the categorical variables across different populations or groups.
How to Find Degrees of Freedom for Chi-Square Tests
To find a p-value from a chi-square statistic value, you must be able to find the degrees of freedom (df) for each of the chi-square tests. This is important because degrees of freedom determine the exact shape of the chi-square distribution used to find the p-value.
The formula for finding degrees of freedom for a chi-square test depends on the type of chi-square test you’re performing. Here’s a quick overview of the formulas for each of the chi-square tests
1) Degrees of Freedom for Chi-Square Test of Independence & Homogeneity
For a chi-square test of independence and a chi-square test of homogeneity, the degrees of freedom formula is df = (r − 1)(c − 1)
Where:
- r is the number of rows in the contingency table
- c is the number of columns in the contingency table
Example 1. Suppose you are analyzing whether gender (male, female) is related to smoking status (smoker, non-smoker, former smoker). Find the appropriate degrees of freedom for this test.
Solution
If you’re to create a contingency table, the table will have 2 rows for the two categories of gender and 3 columns for the three categories of smoking status.
Thus, r = 2 and c = 3
Thus, the correct degrees of freedom for the test are, df = (2-1) * (3-1)
= 1* 2
= 2
2) Degrees of Freedom for Goodness-of-Fit Test
For a chi-square goodness-of-fit test, the degrees of freedom formula is df = k − 1
Where k is the number of categories in the group under investigation.
Example 2. Suppose you wish to test whether survey responses fall equally into 4 categories. Find the correct degrees of freedom for the test.
Solution
This is a chi-square goodness-of-fit test example. So, we know that k = 4
Thus, degrees of freedom, df = k-1
= 4-1
= 3
Finding the P-Value from a Chi-Square Statistic Using the Calculator: An Example
Example 3. Suppose a researcher wants to determine whether smoking status is associated with gender among university students. The researcher classifies students into the following categories:
- Gender: Male, Female, Non-binary
- Smoking status: Non-smoker, Occasional smoker, Regular smoker
After conducting a chi-square test of independence using software, the test statistic was 7.16. Determine the correct p-value for this test.
Solution
From the question, if a contingency table were to be created, it would have 3 rows and 3 columns.
Thus, r = 3 and c = 3
The correct degrees of freedom, df = (r-1) * (c-1)
=(3-1) * (3-1)
=4
Therefore, to find the correct p-value using the calculator, follow these steps:
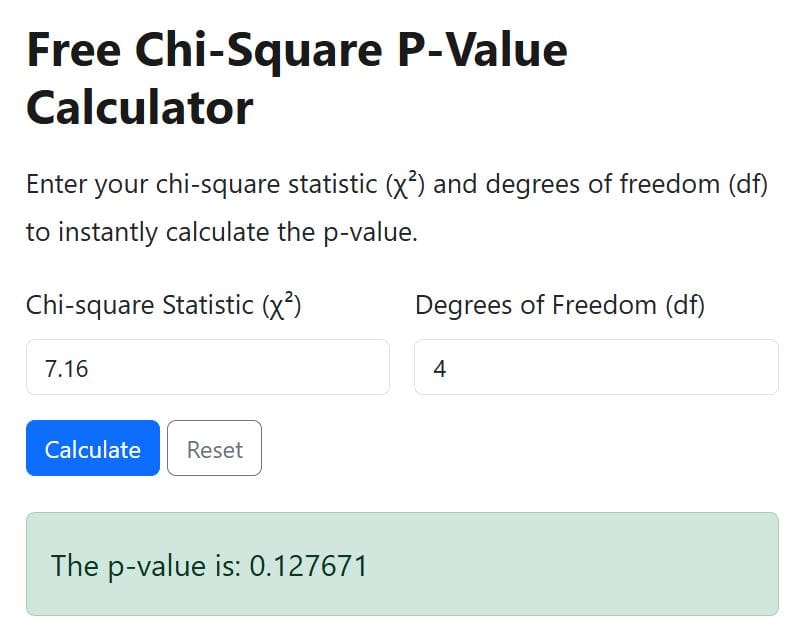
- Enter 7.16 as the chi-square test statistic
- Enter 4 degrees of freedom
- Click the Calculate button
The calculator shows that the p-value for the test is 0.127671, as shown below:
To make the decision regarding the hypothesis, you can also use the calculator and specify your significance level. The calculator will instantly tell you whether to reject or fail to reject the null hypothesis.
Here’s how you can make the decision:
Since the p-value (0.12767) is greater than the significance level (0.05), we fail to reject the null hypothesis. Therefore, at 5% significance level, there is not sufficient evidence to conclude that there is a significant association between gender and smoking status in this sample.
Frequently Asked Questions
To calculate the p-value from a chi-square statistic, you need two values: the chi-square test statistic (χ²) and the degrees of freedom (df). Enter these values into the chi-square p-value calculator and click Calculate. The calculator will instantly compute the probability P(χ² ≥ observed value) from the chi-square distribution.
Yes. The chi-square test is always a right-tailed test because the chi-square statistic measures the magnitude of the difference between observed and expected frequencies. Larger values indicate greater deviations from what is expected under the null hypothesis. Therefore, the p-value is calculated as P(χ² ≥ observed value).
A small p-value indicates that the observed frequencies differ substantially from the expected frequencies under the null hypothesis. Thus, if the p-value is less than or equal to the significance level (α), we reject the null hypothesis and conclude that the results are statistically significant.
No. A p-value cannot be greater than 1 because it represents a probability. In chi-square tests, the p-value always lies between 0 and 1, where smaller values indicate stronger evidence against the null hypothesis.
Yes. This chi-square p-value calculator works for any chi-square test as long as you know the test statistic and degrees of freedom. This includes the chi-square test of independence, chi-square goodness-of-fit test, and chi-square test of homogeneity.