
This F-statistic p-value calculator computes the p-value for an F-test given the F-statistic, the numerator degrees of freedom (df1), and the denominator degrees of freedom (df2). You can also expand the step-by-step explanation to see how the p-value was calculated.
Step-by-step solution
Want to use the critical value approach? Use the F-critical value calculator.
How to Use the F to P-Value Calculator
Finding the p-value for any F-test with this tool is quick and straightforward. You don’t have to use the f-critical value table. Just follow these simple steps:
- Enter the F-statistic value obtained from ANOVA, regression, or equality of variance test
- Enter the numerator degrees of freedom (df1)
- Enter the denominator degrees of freedom (df2)
- Click the “Calculate” button
The calculator will instantly compute the p-value for your F-test. It also has an extended option where you can specify your significance level to help you make the right decision based on the p-value.
Want to learn how to compute the p-value from f-statistic? Expand the step-by-step explanation section.
What is an F-Statistic?
An F-statistic is a test statistic used in F-tests to determine whether there are significant differences between groups or whether a statistical model explains a meaningful amount of variation in the data. It is calculated as a ratio of two variances, which is why it follows the F distribution.
The F-statistic is commonly used in major statistical tests, such as:
- Analysis of variance (ANOVA) to test whether there are significant differences in means of three or more groups.
- Regression analysis to test whether the overall regression model significantly predicts the outcome variable.
- Variance ratio tests to determine whether the variances are equal (homogeneity of variance test).
How the p-value is used in F-tests
After computing the F-statistic, the next step is to determine whether to reject or fail to reject the null hypothesis. In this case, you can either use the F-critical value approach or the p-value. The p-value represents the probability of observing an F-statistic value at least as extreme as the one obtained if the null hypothesis is true.
The decision rule of the p-value approach is as follows:
- Reject the null hypothesis if the p-value is less than or equal to the significance level (α)
- Fail to reject the null hypothesis if the p-value is greater than the significance level (α)
Note. Our F ratio to p-value calculator not only provides you with a p-value, but also gives you the right decision, once you specify the significance level.
Worked Example: Finding the P Value from an F Statistic
Suppose a researcher wants to determine whether three different training programs lead to different levels of employee productivity. A one-way ANOVA is conducted to compare the mean productivity scores across the three programs. After running the analysis, the statistical software reports the following results:
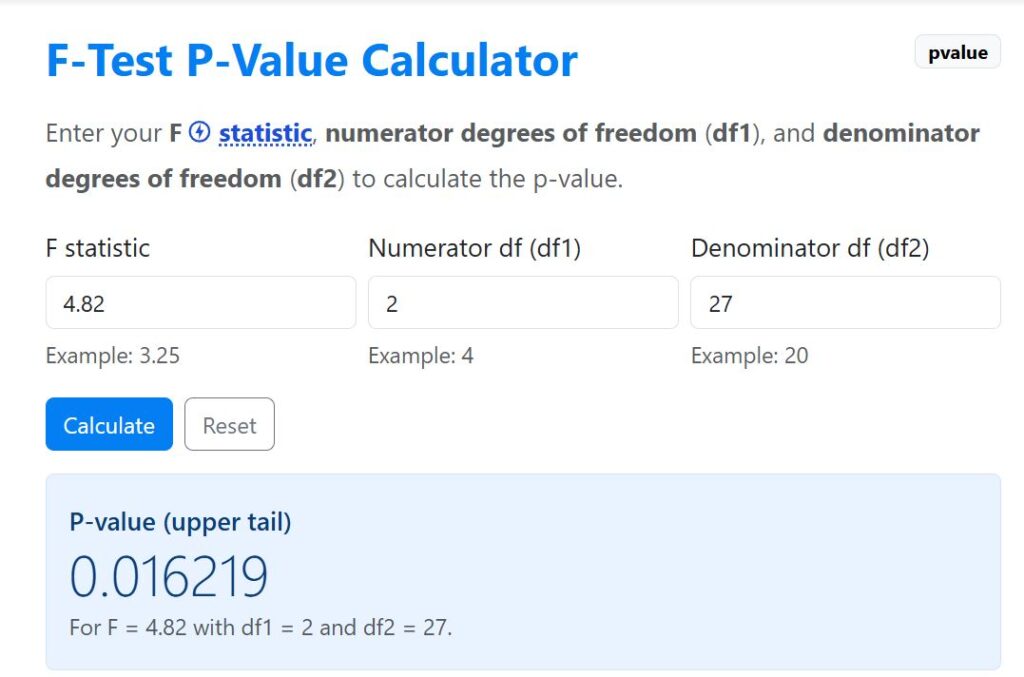
- F statistic (F) = 4.82
- Numerator degrees of freedom (df1) = 2
- Denominator degrees of freedom (df2) = 27
Calculate the p-value for this test.
Solution
To find the p-value for this test using the calculator, follow these steps:
- Enter 4.82 in the F-statistic input field
- Enter 2 in the “Numerator df (df1)” input field
- Enter 27 in the “Denominator df (df2)” input field
- Click Calculator
The calculator instantly returns the correct p-value as 0.016219 (see the figure below).
Want to make decisions about your hypotheses? Specify the significance level (e.g., 0.05) and click the “Get Decision” button.
The calculator instantly outputs the following decision at the 0.05 significance level.
Decision: Since p-value (0.016219) ≤ α (0.05), we reject the null hypothesis.
Your result is statistically significant.
Why Use This F Statistic P-Value Calculator?
Finding a p-value from an F-statistic manually can be tiresome. This is because you need to peruse various F-distribution tables to get the right p-value. However, with this tool, you get instant results with a click of a button.
Here’s why you should use the p-value from the F calculator:
- Instant p-value calculation.
- Accurate and reliable results
- In addition to the p-value, the tool allows you to enter a significance level (α) and instantly get the correct decision of whether to reject or fail to reject the null hypothesis.
- Step-by-step explanation showing you how exactly the p-value was obtained.
- Finds p-value for various f-tests including ANOVA, Regression, and Equality of variance test
