This calculator computes the p-value from a t statistic. You only need to enter the t-statistic value, degrees of freedom (df), select the alternative hypothesis, and specify your significance level (α). The calculator will instantly return the correct p-value for your alternative hypothesis, and tell you whether or not to reject the null hypothesis.
The calculator then displays all the possible p-values for all possible alternative hypothesis tests (right-tailed, left-tailed, and two-tailed).
Free T-value to P-value Calculator
Want to use the classical approach to determine whether to reject or fail to reject the null hypothesis? Use the t-critical value calculator instead.
How to Use the P-value From the T-value Calculator
Struggling to find the p-value from t? You can easily find the p-value for any alternative hypotheses (right-tailed, left-tailed, or two-tailed) using this p-value calculator from t. Simply follow these steps:
- Enter the t-value (test statistic from t-tests)
- Enter the correct degrees of freedom (df)
- Select the alternative hypothesis of the test (left-tailed, right-tailed, or two-tailed)
- Specify the significance level (α)
- Click the “Calculate” button
The calculator will instantly return the correct p-value for the selected alternative hypothesis and tell you whether to reject or fail to reject the null hypothesis. It will also present you with all the possible p-values for the test (right-tailed p-value, left-tailed p-value, and two-tailed p-value).
What is a P-Value in a T-Test?
A p-value in a t-test is the probability of obtaining a result as extreme as (or more extreme than) your observed t statistic if the null hypothesis (H₀) is true.
A p-value helps you determine whether to reject or fail to reject the null hypothesis after performing a t-test. Specifically, we compare the p-value with the significance level (α) and make the decisions as follows:
- Reject the null hypothesis (H₀) if the p-value is less than the significance level (α)
- Fail to reject the null hypothesis (H₀) if the p-value is greater than the significance level (α)
Tip. In statistics, you should never say you “accept” the null hypothesis (H₀). Instead, you say you “fail to reject” it. This phrasing is crucial because failing to find evidence against a claim is not the same as proving the claim is true
Examples: How to Find P-Value from T Using the Calculator
Still wondering how you can use the p-value from the t calculator to solve t-test problems? Below are practical, exam-style examples showing how to calculate the p-value from t statistic using the calculator.
Example 1: Two-Tailed Test
A researcher wants to test whether the average stress score of postgraduate students differs from 50. A sample of 19 students produces a test statistic of t = 2.45. Using the p-value approach, determine whether we can conclude that the average stress differs from 50 at the 5% significance level.
Step 1. State the Hypotheses
- H₀: μ = 50
- H₁: μ ≠ 50
Because the question says “differs”, this is a two-tailed test.
Step 2. Calculate the degrees of freedom (df)
Since this is a one-sample t-test problem, the degrees of freedom formula is, df = n-1
Thus, df = 19-1
=18
Step 3. Calculate the P-Value Using the Calculator
Since we already know all the parameters: test statistic, t =2.45, df = 18, type of test is two-tailed, and significance level is 0.05 (5%), we can easily find the p-value using the calculator.
To find the p-value from t using the calculator, just follow these simple steps.
- Enter the test statistic, t = 2.45
- Enter the degrees of freedom, df = 18
- Select a two-tailed test
- Enter 0.05 as the significance level
- Click Calculate
On clicking the “Calculate” button, the calculator will instantly show the results as shown below.
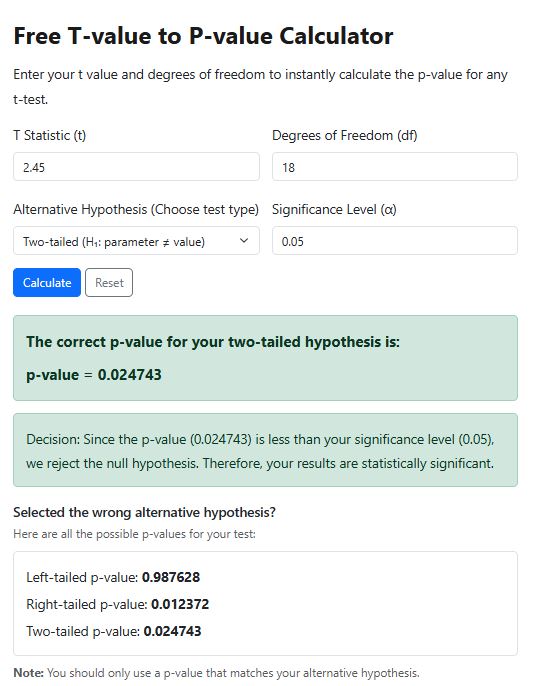
From the results, we see that the p-value for this test is 0.0247.
Step 4. Make a Decision
Our calculator not only gives you the p-value for your test. It also displays the decision based on your p-value as follows:
Since the p-value (0.024743) is less than your significance level (0.05), we reject the null hypothesis. Therefore, your results are statistically significant.
Step 5. Make Conclusion
There is sufficient evidence at the 5% significance level to conclude that the average stress score of postgraduate students differs from 50.
Example 2: Left-Tailed Test
A lecturer wants to test whether a revision program reduces exam anxiety. After comparing pre-test and post-test scores for 23 students, the analysis produces a test statistic of t = -1.90. Using the p-value approach, determine whether we can conclude that the program reduces anxiety at the 5% significance level.
Step 1. State the Hypotheses
H₀: μ₁ − μ₂ = 0 or μd = 0
H₁: μ₁ − μ₂ < 0 or μd < 0
Because the claim is that the program reduces anxiety, this is a left-tailed test.
Step 2. Calculate the Degrees of Freedom (df)
Since this is a paired t-test (same students measured twice), the degrees of freedom formula is:
df = n − 1
Thus,
df = 23 − 1
= 22
Step 3. Calculate the p-value using the calculator
We already know:
- Test statistic, t = -1.90
- df = 22
- Type of test = Left-tailed
- Significance level = 0.05
To find the correct p-value from t using the calculator, follow these simple steps:
- Enter the test statistic, t = -1.90
- Enter the degrees of freedom, df = 22
- Select a Left-tailed test
- Enter 0.05 as the significance level
- Click the “Calculate” button
The calculator will instantly display the correct p-value as shown below.
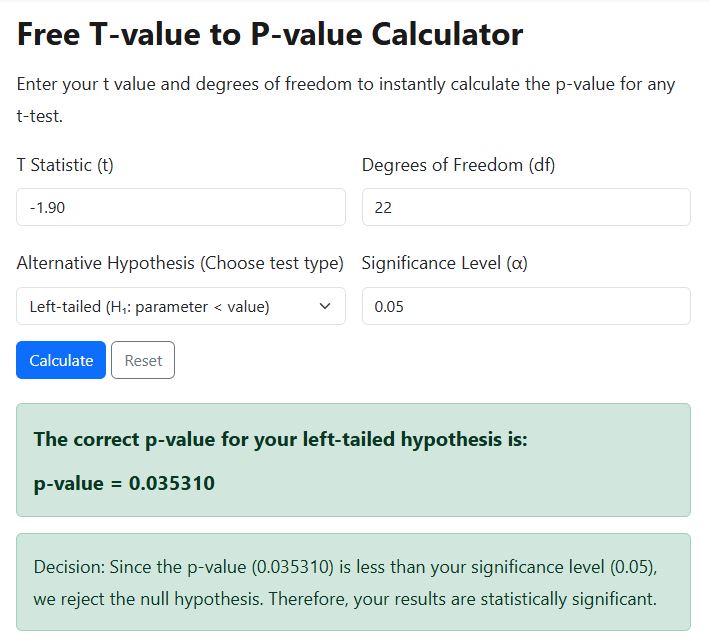
From the output, we see that the p-value for this test is 0.035310
Step 4. Make a Decision
Since the p-value (0.035) is less than the significance level (0.05), we reject the null hypothesis.
Therefore, the result is statistically significant.
Step 5. Make Conclusion
There is sufficient evidence at the 5% significance level to conclude that the revision program reduces exam anxiety.
Example 3: Right-Tailed Test
A company claims that employees who complete a training program perform better than those who do not. An independent t-test produces a test statistic of t = 1.75 based on a total of 17 participants in each group. Using the p-value approach, determine whether the training improves performance at the 5% significance level (Assume variances to be equal).
Step 1. State the Hypotheses
H₀: μ₁ ≤ μ₂
H₁: μ₁ > μ₂
Because the claim is that trained employees perform better, this is a right-tailed test.
Step 2. Calculate the Degrees of Freedom (df)
Since this is an independent samples t-test, the degrees of freedom formula is:
df = n₁ + n₂ − 2
Thus, df = 17+17 -2
df = 32
Step 3. Calculate the p-value using the calculator
We already know:
- Test statistic, t = 1.75
- df = 32
- The type of test is Right-tailed
- Significance level = 0.05
To find the p-value from t using the calculator, follow these steps:
- Enter the test statistic, t = 1.75
- Enter the degrees of freedom, df = 32
- Select a Right-tailed test
- Enter 0.05 as the significance level
- Click the “Calculate” button
The calculator will instantly display the results and decision as shown below.
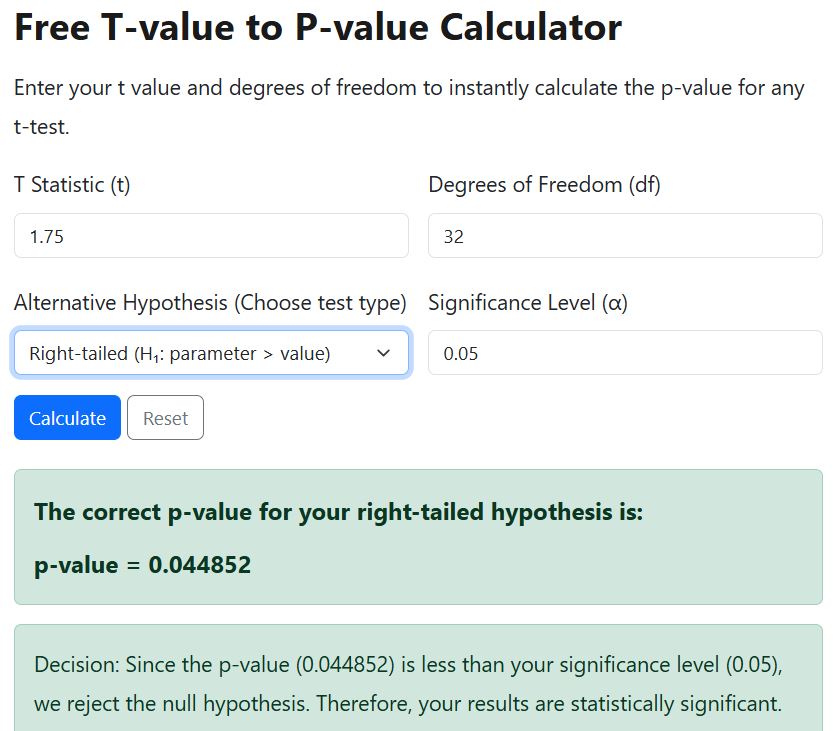
From the output, we find that the p-value is 0.044852
Step 4. Make a Decision
Since the p-value (0.044852) is less than the significance level (0.05), we reject the null hypothesis at the 5% level.
Step 5. Make Conclusion
There is insufficient evidence at the 5% significance level to conclude that the training program improves employee performance.
Common T-Tests, where You Calculate the P-Value from a T Statistic
If you’ve computed a t statistic in your analysis, chances are you’ll need to convert it into a p-value to complete your hypothesis test. Below are the most common t-tests where you calculate the p-value from a t statistic:
- One-Sample T-Test
- Independent Samples T-Test
- Paired Samples T-Test
- Welch’s T-Test (Unequal Variances T-Test)
- Pearson Correlation Significance Test
- Simple Linear Regression Coefficient Test
- Multiple Regression Coefficient Tests
Degrees of Freedom Formulas for Common T-Tests
Before you calculate the p-value from a t statistic, you must know the correct degrees of freedom (df). The table below provides a quick reference to degrees of freedom formulas for common t-tests.
| T-Test Type | Degrees of Freedom (df) Formula |
|---|---|
| One-Sample T-Test | df = n − 1 |
| Paired Samples T-Test | df = n − 1 |
| Independent Samples T-Test (Equal Variances) | df = n₁ + n₂ − 2 |
| Welch’s T-Test (Unequal Variances) | df ≈ Welch–Satterthwaite formula |
| Pearson Correlation Test | df = n − 2 |
| Simple Linear Regression (Slope Test) | df = n − 2 |
| Multiple Regression (Individual Predictor Test) | df = n − k − 1 |
| Partial Correlation | df = n − k − 2 |
Why Use the P-Value From T Calculator?
When working with t-tests, you are often given a t-statistic and degrees of freedom. However, converting that value into a p-value using a t-table can be slow and inaccurate. Most tables only provide approximate critical values (not the exact probability).
Here’s why you should use a free online t-value to p-value calculator.
It allows you to:
- Calculate the exact p-value from any t statistic
- Handle left-tailed, right-tailed, and two-tailed tests
- Avoid errors from manual t-table lookups
- Save time during exams, assignments, and dissertation analysis
- Make quick hypothesis testing decisions at any significance level