This calculator computes the population standard deviation (σ) for your data. Enter the data and click the “Calculate” button to get instant results, with a clear step-by-step solution.
Population Standard Deviation Calculator
DescriptiveEnter your values separated by commas, spaces, or tabs (you can paste directly from Excel). This calculator computes the population standard deviation (σ).
Want to calculate the sample standard deviation instead? Use the sample standard deviation calculator for instant results and a step-by-step solution.
How to Use the Population Standard Deviation Calculator
To find the population standard deviation using the calculator, follow these simple steps:
- Step 1. Enter the data (You can separate it by commas, spaces, tabs, or even copy-paste from Excel).
- Step 2. Click the “Calculate” button
This tool will give you instant results, along with a clear step-by-step explanation of how to calculate the population standard deviation by hand.
Want to find the population and sample standard deviation in one tool without switching between pages? Use the standard deviation calculator with steps.
What is Population Standard Deviation?
Population standard deviation is one of the statistical measures of dispersion, which quantifies the amount of variation in an entire dataset (population) relative to its population mean. In other words, it indicates how tightly data points are clustered around the population average, with higher values representing greater variability.
Population Standard Deviation Formula
The formula for the population standard deviation (σ) is:
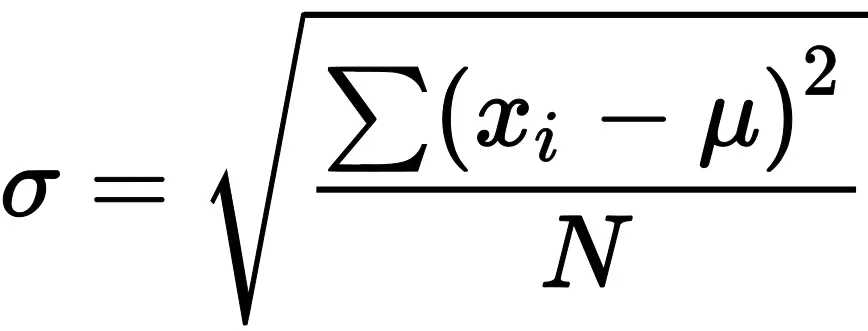
Where:
- σ is the population standard deviation
- N is the total number of observations in the population
- xi is each individual value in the population
- μ is the population mean (average of all values)
Population vs. Sample Standard Deviation
While both population and sample standard deviation measure how spread out the data is, they differ in what they represent and their formulas. Here are the key differences:
- Population Standard Deviation (σ) is used when you have the entire dataset from the population. The formula divides the sum of squared deviations by N (total number of observations in the population)
- The sample standard deviation is used when you have sample data drawn from the population. The formula divides the sum of squared deviations by n-1 (n is the sample size) instead of N. This helps to account for the fact that a sample is only an estimate of the population.
Frequently Asked Questions
Population standard deviation measures how much the values in an entire population vary from the population mean. It helps understand the overall variability or spread of data.
Population standard deviation uses N (the total number of values) in the denominator, while sample standard deviation uses n−1.
To calculate population standard deviation, follow these steps:
Step 1. Find the population mean.
Step 2. Subtract the mean from each value and square the result.
Step 3. Sum all squared deviations.
Step 4. Divide the sum by the total number of values (N).
Step 5. Take the square root of the result.
No. This calculator is specifically for population standard deviation. If you have a sample, you should use a sample standard deviation calculator, which divides by n−1 instead of N.