A T distribution table is a reference table used in statistics to find t critical values for t-tests and confidence intervals that use t statistic. The table is also referred to as the Student’s t table, t critical value table, or t-table.
To use the table, you need to understand its key components, which are:
- Degrees of freedom (df), which you can find in the rows of the table
- Significance level (α), which you can find in the columns of the table
- The critical value, which is located at the intersection of df and α
This page shows the main t-tables you can use to find t-critical values for one-sided or two-sided tests.
Want to use the t-distribution table locally on your machine?
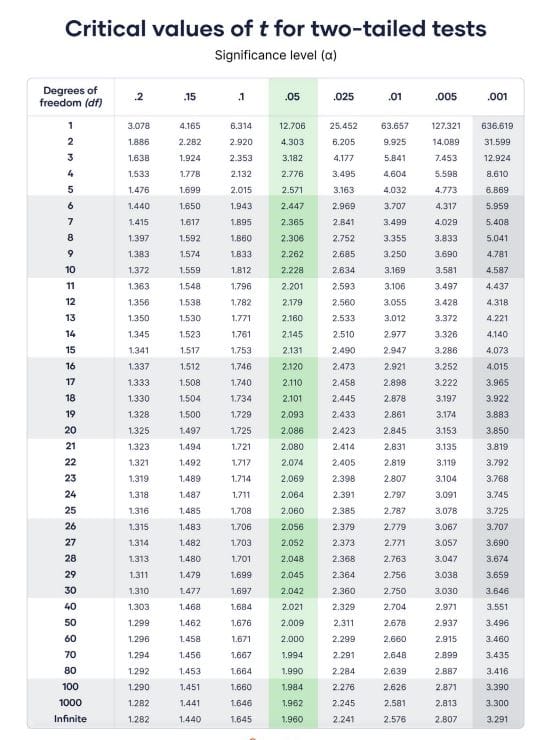
T Critical Value Table for Two-Tailed Tests
The table below shows a T-distribution table (also known as the t-critical value table) for two-tailed tests. Use it to find critical values for two-tailed t-tests and confidence intervals.
Note. With this table, you don’t have to divide the significance level (α) by 2. Simply read the values as they are:
How to Use a T Table for Two-Tailed Tests
To use a t-table for two-tailed tests, follow these steps:
- Identify the significance level (α)
- Calculate the degrees of freedom (df) for your test
- Locate the intersection of df and α
The intersection gives you the t-critical value for your two-sided t-test or confidence interval.
Example 1. A researcher is analyzing whether a population mean differs from a hypothesized value using a sample of 42 observations. The significance level for the analysis is α = 0.01, and the population standard deviation is unknown. Find the appropriate t-critical value for the test.
Solution
Since the aim is to determine if the mean differs from a hypothesized value, this is a non-directional test. Thus, we need to find a critical value of t for a two-tailed test.
From the example, we know that α = 0.01 and the sample size, n = 42
Since the appropriate statistical test is a one-sample t-test, we calculate the degrees of freedom using the formula df = n-1.
Thus, df = 42-1 = 41
Locating the intersection of α = 0.01 and df = 41 gives 2.704
Note. We used 40 since 41 is not listed in the t table and looked up for the intersection of α = 0.01 and df = 40
Therefore, the appropriate t-critical value for the test is 2.704
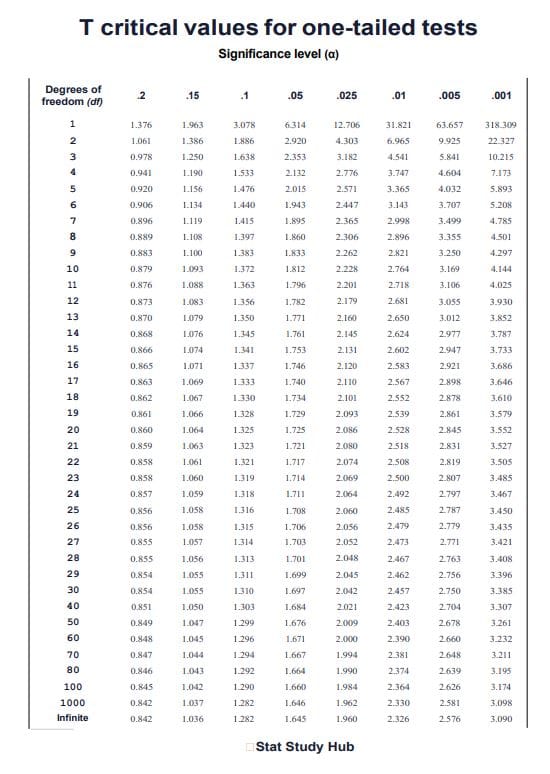
T Critical Value Table for One-Tailed Tests
The table below shows the student’s t table for one-tailed tests. The table is ideal if you want to look up critical values for t without having to modify the significance level (α).
In other words, use the table as it is to find any one-sided t critical value.
How to Use a T Table for One-Tailed Tests
Reading the critical values of t for a one-tailed test from the table above is simple. Just follow these steps:
- Identify the significance level (α)
- Calculate the degrees of freedom (df) for your test
- Locate the intersection of df and α
The intersection gives you the correct critical value for your t-test.
Example 2. A production manager wants to determine whether the average output of a machine exceeds 120 units per day. A random sample of 30 days is selected, and the population standard deviation is unknown. The analysis is conducted at a 5% significance level. Find the appropriate t-critical value for the test.
Solution
Since the aim is to determine whether the population mean exceeds a specified value, this is a directional test. Therefore, we need to find the critical value of t for a one-tailed test.
From the example, we are given: significance level, α = 0.05, and sample size, n = 30
Because the appropriate statistical test is a one-sample t-test, the degrees of freedom are calculated as: df=n−1
=30−1
=29
Using the t-Table
- Locate the row corresponding to df = 29
- Move across to the column for α = 0.05 (one-tailed)
- Read the value at the intersection
From the t-table, the critical value is t = 1.699
Therefore, the t-critical value for the test is 1.699
Combined T Table for One-Tailed and T-Tailed Test
The table below is a combined T Table for one-tailed and two-tailed tests. It provides critical t-values for both one-tailed and two-tailed tests. With this table, you can quickly find the appropriate t-critical values for one-sided or two-sided tests without consulting separate tables.
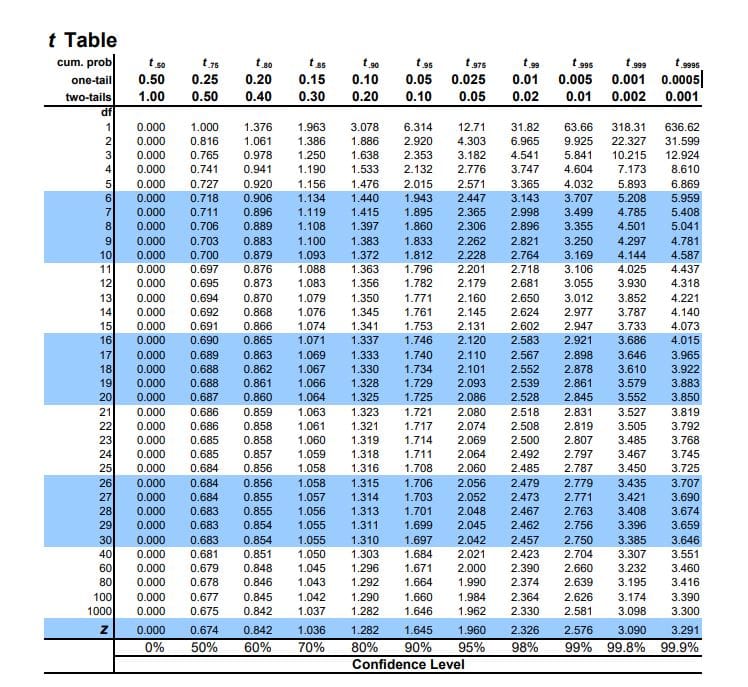
How to Use the Combined T-Table
To find the correct critical t value using the combined t-table, follow these steps:
- Identify the type of test (whether one-tailed or two-tailed)
- Identify the significance level (α)
- Calculate the correct degrees of freedom
- Locate the Correct Row and Column
- Find the critical value. The value at the intersection of your df row and α column is your critical t-value
Want a quick way to find the critical values without the tables? Try our t-critical value calculator.