Skip to content

What is Margin of Error? Definition, Formula, and Examples

Published on: Last updated: Joseph Mburu 24 min read

When reading survey results, you might come across a percentage followed by a ± value. For example, a poll may say that 58% of respondents support a policy with a margin of error of ±4%. The ±4% is the margin of error (MOE), which tells you that the survey result is not an exact value but rather a sample estimate. In particular, it helps you understand how much a sample result differ from the true population value.

Margin of error is commonly used in surveys, opinion polls, market research, academic studies, and public health research. In this guide, you will learn what margin of error is, its formula, how to calculate it, and how to interpret the results.

What is Margin of Error?

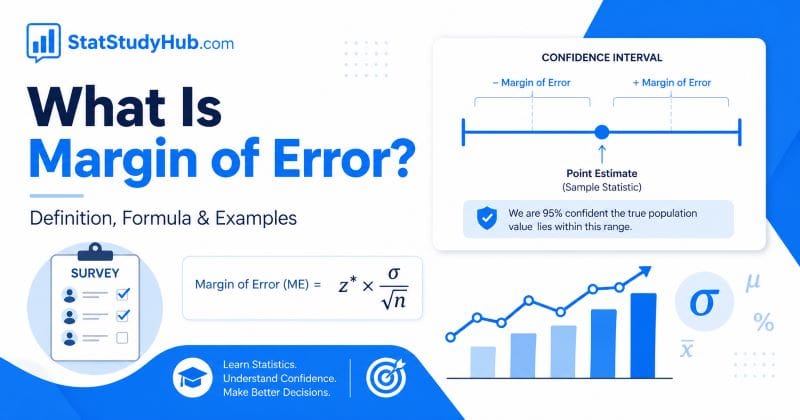
The margin of error is a statistical value that shows how much a sample result is expected to differ from the true population value. It tells you how much uncertainty surrounds your estimate.

MOE is commonly used in surveys, polls, and research studies that rely on sample data rather than complete population data. In practice, researchers report the margin of error alongside survey results to tell the reader how precise the study results are.

For example, if a survey reports that 52% of respondents prefer Product A with a margin of error of ±4%, that means the true population proportion is likely to be somewhere between 48% and 56%, assuming the sampling method is appropriate and the confidence level is correct.

Tip. A smaller margin of error means the estimate is more precis while a larger one means there is more uncertainty around the sample result.

Why Margin of Error Matters

Whenever you use a sample instead of collecting data from every person in the population, there is always some level of sampling uncertainty. Even if the sample is selected properly, the result will usually not match the exact population value perfectly.

That is where the margin of error becomes useful.

It helps answer practical questions such as:

  • How accurate is this survey result?
  • How much could the estimate vary?
  • Is the difference between two percentages meaningful?
  • Can I trust a close result?

Without a margin of error, a single percentage can look more certain than it really is.

Margin of error matters because most research studies use samples instead of entire populations.

For example, if you want to know what all university students think about online learning, it may not be possible to ask every student. Instead, you may collect responses from a sample and use that sample to estimate the opinion of the full population.

However, a sample result will rarely match the true population value exactly. Some difference is expected because you are only studying part of the population.

The margin of error helps answer questions such as:

  • How precise is this survey result?
  • How much could the estimate vary?
  • Can I trust a close percentage difference?
  • Is one option clearly ahead of another?
  • How wide is the likely range around the sample result?

Without a margin of error, a single percentage can look more certain than it really is.

Margin of Error Formula

The formula for margin of error depends on whether the population is very large or whether the population size is known and finite.

For most surveys and polls, the margin of error is calculated for a sample proportion. A sample proportion is a percentage or fraction, such as 40%, 55%, or 0.70.

Formula for a Large or Unknown Population

When the population is very large or unknown, the standard margin of error formula is:

The margin of error for a population proportion is based on the confidence level, the sample proportion, and the sample size.

When the population is very large or unknown, the standard margin of error formula is:

MOE=Zα/2p(1p)nMOE = Z_{\alpha/2}\sqrt{\frac{p(1-p)}{n}}

Where:

  • MOE is the margin of error
  • Z is the critical value based on the selected confidence level
  • p is the sample proportion
  • n is the sample size

This is the formula most margin of error calculators use by default.

This formula is commonly used when the population is large enough that the finite population correction is not needed.

For example, if you are surveying adults in a large country, you may treat the population as very large unless you are sampling a large share of that population.

Formula for a Known Finite Population

When the population size is known and the sample is a noticeable part of the population, you can apply the finite population correction.

The formula becomes:

However, for a known and finite population size, the margin of error formula is adjusted using the finite population correction. In this case, the formula becomes:

MOE=Zα/2p(1p)n×NnN1MOE = Z_{\alpha/2} \sqrt{\frac{p(1-p)}{n}} \times\sqrt{\frac{N-n}{N-1}}

Where:

  • N is the known population size

This adjustment slightly reduces the margin of error when the sample makes up a noticeable share of the total population.

The finite population correction slightly reduces the margin of error when the sample makes up a meaningful share of the population.

For example, surveying 300 employees out of 1,000 is different from surveying 300 people out of 1,000,000. In the first case, the sample represents a much larger share of the population.

Note. Z is the two-tailed critical value for your chosen confidence level. For instance, for 90% confidence level, z = 1.645, for 95%, z = 1.96, and for 99%, z = 2.576. If you want to find the z value for any other confidence level, you can use our free critical z value calculator.

Tip. The margin of error formula is derived from Cochran’s sample size formula, but here it is rearranged to solve for the margin of error rather than the sample size.

Margin of Error Formula Symbols

Here is a simple summary of the symbols used in the margin of error formula.

SymbolMeaning
EEEMargin of error
zzzCritical value based on the confidence level
pppSample proportion
1p1-p1−pComplement of the sample proportion
nnnSample size
NNNPopulation size

The most important values are the confidence level, sample proportion, and sample size. If the population size is known and finite, NNN is also used.


Common Confidence Levels and Z-Scores

The confidence level tells you how confident you want to be that the interval contains the true population value.

Common confidence levels use the following z-scores:

Confidence LevelZ-Score
80%1.282
85%1.440
90%1.645
95%1.960
99%2.576

A 95% confidence level is commonly used in surveys and academic research.

A higher confidence level gives a larger z-score. A larger z-score gives a wider range and therefore a larger margin of error.

For example, a 99% confidence level gives a larger margin of error than a 95% confidence level because it requires a wider interval.

How to Calculate Margin of Error

To calculate the margin of error, you need to know the confidence level, sample proportion, and sample size. If the population size is known and finite, you can also include the finite population correction.

The general steps are:

  1. Identify the confidence level.
  2. Find the corresponding z-score.
  3. Identify the sample proportion, p.
  4. Identify the sample size, n.
  5. Choose the correct formula.
  6. Substitute the values into the formula.
  7. Convert the final answer into a percentage.

The following examples show how to calculate margin of error for both a large or unknown population and a finite population.

Example 1: Margin of Error for a Large or Unknown Population

Suppose a survey finds that 60% of respondents support a proposal. The sample size is 400, and the confidence level is 95%. Find the margin of error.

Step 1: Identify the Confidence Level

The confidence level is 95%.

For a 95% confidence level, the corresponding z-score is:z=1.96z = 1.96z=1.96

Step 2: Find the Corresponding Z-Score

Since the confidence level is 95%, we use:z=1.96z = 1.96z=1.96

Step 3: Identify the Sample Proportion

The survey result is 60%, so the sample proportion is:p=0.60p = 0.60p=0.60

Then:1p=10.60=0.401-p = 1-0.60 = 0.401−p=1−0.60=0.40

Step 4: Identify the Sample Size

The sample size is:n=400n = 400n=400

Since the population size is not given, we treat the population as large or unknown.

Step 5: Choose the Correct Formula

Because the population is large or unknown, we use the standard margin of error formula:E=zp(1p)nE = z \sqrt{\frac{p(1-p)}{n}}E=znp(1−p)​​

Step 6: Substitute the Values Into the Formula

Substitute z=1.96z = 1.96z=1.96, p=0.60p = 0.60p=0.60, 1p=0.401-p = 0.401−p=0.40, and n=400n = 400n=400:E=1.960.60(0.40)400E = 1.96 \sqrt{\frac{0.60(0.40)}{400}}E=1.964000.60(0.40)​​ E=1.960.24400E = 1.96 \sqrt{\frac{0.24}{400}}E=1.964000.24​​ E=1.960.0006E = 1.96 \sqrt{0.0006}E=1.960.0006​

Step 7: Convert the Final Answer Into a Percentage

First, solve the square root:0.0006=0.0245\sqrt{0.0006} = 0.02450.0006​=0.0245

Then multiply by the z-score:E=1.96×0.0245E = 1.96 \times 0.0245E=1.96×0.0245 E=0.0480E = 0.0480E=0.0480

Convert the result to a percentage:0.0480×100=4.80%0.0480 \times 100 = 4.80\%0.0480×100=4.80%

Therefore, the margin of error is:±4.80%\pm 4.80\%±4.80%

This means the true population proportion is likely to fall within:60%±4.80%60\% \pm 4.80\%60%±4.80%

So, the likely range is:55.2% to 64.8%55.2\% \text{ to } 64.8\%55.2% to 64.8%


Example 2: Margin of Error for a Finite Population

Suppose a school has 2,000 students. A survey of 300 students finds that 55% prefer online revision quizzes. Use a 95% confidence level to calculate the margin of error.

Step 1: Identify the Confidence Level

The confidence level is 95%.

For a 95% confidence level, the corresponding z-score is:z=1.96z = 1.96z=1.96

Step 2: Find the Corresponding Z-Score

Since the confidence level is 95%, we use:z=1.96z = 1.96z=1.96

Step 3: Identify the Sample Proportion

The survey result is 55%, so the sample proportion is:p=0.55p = 0.55p=0.55

Then:1p=10.55=0.451-p = 1-0.55 = 0.451−p=1−0.55=0.45

Step 4: Identify the Sample Size

The sample size is:n=300n = 300n=300

The population size is also known:N=2000N = 2000N=2000

Since the population size is known and finite, we use the finite population correction.

Step 5: Choose the Correct Formula

Because the population size is known, we use the finite population margin of error formula:E=zp(1p)n×NnN1E = z \sqrt{\frac{p(1-p)}{n}} \times \sqrt{\frac{N-n}{N-1}}E=znp(1−p)​​×N−1N−n​​

Step 6: Substitute the Values Into the Formula

Substitute z=1.96z = 1.96z=1.96, p=0.55p = 0.55p=0.55, 1p=0.451-p = 0.451−p=0.45, n=300n = 300n=300, and N=2000N = 2000N=2000:E=1.960.55(0.45)300×200030020001E = 1.96 \sqrt{\frac{0.55(0.45)}{300}} \times \sqrt{\frac{2000-300}{2000-1}}E=1.963000.55(0.45)​​×2000−12000−300​​ E=1.960.2475300×17001999E = 1.96 \sqrt{\frac{0.2475}{300}} \times \sqrt{\frac{1700}{1999}}E=1.963000.2475​​×19991700​​ E=1.960.000825×0.8504E = 1.96 \sqrt{0.000825} \times \sqrt{0.8504}E=1.960.000825​×0.8504​ E=1.96(0.02872)(0.9221)E = 1.96(0.02872)(0.9221)E=1.96(0.02872)(0.9221)

Step 7: Convert the Final Answer Into a Percentage

Now solve:E=0.0519E = 0.0519E=0.0519

Convert the result to a percentage:0.0519×100=5.19%0.0519 \times 100 = 5.19\%0.0519×100=5.19%

Therefore, the margin of error is:±5.19%\pm 5.19\%±5.19%

This means the true population proportion is likely to fall within:55%±5.19%55\% \pm 5.19\%55%±5.19%

So, the likely range is:49.81% to 60.19%49.81\% \text{ to } 60.19\%49.81% to 60.19%

You can verify this result using our margin of error calculator.

Case 1. Margin of Error for a Large or Unknown Population (Infinite Population)

If the population is very large or you do not know its size, it is said to be infinite. In this case, we use the standard margin of error formula and follow these simple steps:

  1. Identify the parameters (confidence level, sample proportion (p), and sample size (n)
  2. Substitute the values in the formula
  3. Solve the equation to get the margin of error

Example 1. Margin of Error for an Infinite Population

Suppose a survey finds that 60% of respondents support a proposal. The sample size is 400, and the confidence level is 95%. Find the margin of error.

Solution

Step 1. Identify the parameters

From the question, we know that:

  • The confidence level is 95%. Thus, the corresponding z critical value is 1.96
  • The sample proportion is 60%. That’s p = 0.6
  • The sample size, n = 400

Step 2. Substitute the values into the formula

By definition, the standard margin of error formula is E=Zα/2p(1p)nE = Z_{\alpha/2}\sqrt{\frac{p(1-p)}{n}}

Substituting the values into the formula, we have:

E=1.96×0.6(10.6)400E = 1.96\times\sqrt{\frac{0.6(1-0.6)}{400}}

Step 3. Solve the Equation

Solving the equation, we get:

E=1.96×0.6(0.4)400E = 1.96\times\sqrt{\frac{0.6(0.4)}{400}}
=1.96×0.24400= 1.96\times\sqrt{\frac{0.24}{400}}
=1.96×0.0006= 1.96\times\sqrt{0.0006}

Thus, E = 0.0480

Converting this to a percentage, E = 4.80%. Therefore, the margin of error is ±4.80%. This implies that the estimated population proportion is likely to fall within 60% ± 4.80%, or between 55.2% and 64.8%, at the 95% confidence level.

Case 2. Calculating Margin of Error for a Finite Population

If the population size is known and the sample is not tiny relative to the population, we use the finite population correction when calculating the margin of error. The steps are similar to those of an infinite population, only that we apply the finite population correction factor.

Let’s go through an example.

Example 2. Margin of Error for a Finite Population

Suppose a school has 2,000 students. A survey of 300 students finds that 55% prefer online revision quizzes. Use a 95% confidence level to calculate the margin of error.

Solution

Step 1. Identify the parameters

From the question, we know that:

  • The population size, N = 2000
  • The sample size, n = 300
  • The confidence level is 95%. Thus, z = 1.96
  • The sample proportion, p = 0.55

Step 2. Substitute the values into the right formula

By definition, the margin of error formula for a finite population is:

E=Zp(1p)nNnN1E = Z \sqrt{\frac{p(1-p)}{n}} \sqrt{\frac{N-n}{N-1}}

Substituting the values into the formula, we get the following equation:

E=1.96×0.55(10.55)300200030020001E = 1.96\times \sqrt{\frac{0.55(1-0.55)}{300}} \sqrt{\frac{2000-300}{2000-1}}
=1.96×0.55(0.45)30017001999= 1.96\times \sqrt{\frac{0.55(0.45)}{300}} \sqrt{\frac{1700}{1999}}
=1.96×0.0008250.850425= 1.96\times \sqrt{0.000825} \sqrt{0.850425}
=1.96×0.028723×0.9221=1.96\times 0.028723 \times 0.9221

Thus, E = 0.0519

Converting to a percentage, E = 5.19%. Therefore, the margin of error is ±5.19%. This implies that the true population proportion is likely to be within 55% ± 5.19%, or between 49.81% and 60.19%, at the 95% confidence level.

Want to verify whether these results are correct? Use the margin of error calculator and enter the parameters. You’ll get similar results.

How to Interpret Margin of Error Results

The margin of error is usually written with the plus-or-minus symbol (±).

For example, if a survey result is:60%±5%60\% \pm 5\%60%±5%

it means the true population value may be about 5 percentage points lower or higher than the sample result.

The lower end is:60%5%=55%60\% – 5\% = 55\%60%−5%=55%

The upper end is:60%+5%=65%60\% + 5\% = 65\%60%+5%=65%

So, the confidence interval is:55% to 65%55\% \text{ to } 65\%55% to 65%

This does not mean the result is definitely correct. It means that, based on the selected confidence level and sampling method, the true population value is likely to fall within that range.

A smaller margin of error means the estimate is more precise. A larger margin of error means there is more uncertainty around the result.


What Affects the Margin of Error?

The margin of error is affected by several factors. The most important ones are sample size, confidence level, sample proportion, and population size.

Sample Size

Sample size has a strong effect on the margin of error.

A larger sample size usually gives a smaller margin of error because the estimate is based on more observations. A smaller sample size usually gives a larger margin of error because there is less information about the population.

For example, a survey of 1,000 people will usually have a smaller margin of error than a survey of 100 people, assuming the same confidence level and sample proportion.

However, the improvement becomes smaller as the sample size continues to increase. Doubling the sample size does not cut the margin of error in half.


Confidence Level

The confidence level also affects the margin of error.

A higher confidence level gives a larger margin of error because the interval must be wider to give you more confidence that it contains the true population value.

For example:

  • A 90% confidence level gives a smaller margin of error.
  • A 95% confidence level gives a moderate margin of error.
  • A 99% confidence level gives a larger margin of error.

This is why you should choose the confidence level carefully. A higher confidence level sounds better, but it also produces a wider and less precise interval.


Sample Proportion

The sample proportion affects the margin of error because some proportions have more variability than others.

The margin of error is usually largest when the sample proportion is close to 50%. It becomes smaller when the proportion is closer to 0% or 100%.

That is why many calculators and sample size formulas use 50% when the expected proportion is unknown. It gives the most conservative estimate because it assumes the highest level of variability.

For example, if you do not know whether 30%, 50%, or 70% of people will choose an option, using 50% gives the safest estimate.


Population Size

Population size affects the margin of error mainly when the sample is large compared with the total population.

If the population is very large, population size usually has little effect. For example, surveying 400 people from a population of 1,000,000 is not very different from surveying 400 people from a population of 10,000,000.

However, if the sample is a large part of the population, the finite population correction becomes useful.

For example, surveying 400 people from a population of 1,000 is different from surveying 400 people from a very large population. In that case, the margin of error can be adjusted downward.


What to Do When the Margin of Error Is Too Large

Sometimes the margin of error is larger than you want. This means the estimate is not as precise as you need it to be.

The most direct way to reduce the margin of error is to increase the sample size. A larger sample gives more information and usually produces a more precise estimate.

You may also improve the usefulness of your result by:

  • Collecting more responses
  • Extending the survey period
  • Improving the response rate
  • Using a better sampling method
  • Targeting the correct population
  • Reducing missing or poor-quality responses
  • Making the survey questions clearer

However, remember that increasing sample size only reduces sampling error. It does not automatically fix bias caused by poor survey design, non-random sampling, or misleading questions.


When to Use Margin of Error

Margin of error is useful when you are working with sample-based estimates.

You may use it when:

  • Reporting survey results
  • Analyzing opinion polls
  • Estimating population proportions
  • Building confidence intervals
  • Interpreting questionnaire data
  • Comparing close percentages
  • Conducting market research
  • Working with public health survey data
  • Reporting social science research results

For example, if a customer survey shows that 72% of respondents are satisfied with a service, the margin of error helps you understand how close that sample percentage may be to the true percentage among all customers.

Margin of error is especially useful when results are close. If two percentages differ by only a small amount, the margin of error can help you decide whether the difference is meaningful or uncertain.


Margin of Error vs Confidence Interval

Margin of error and confidence interval are closely related, but they are not the same thing.

The margin of error is the amount added to and subtracted from the sample estimate.

The confidence interval is the full range created after applying the margin of error.

For example:

Sample EstimateMargin of ErrorConfidence Interval
60%±5%55% to 65%
48%±4%44% to 52%
72%±3%69% to 75%

If a survey result is 60% and the margin of error is ±5%, the confidence interval is 55% to 65%.

So, the margin of error is one part of the confidence interval.


Margin of Error vs Standard Error

Margin of error and standard error are also related, but they measure different things.

The standard error measures how much a sample estimate is expected to vary from sample to sample.

The margin of error uses the standard error together with a critical value, such as a z-score, to create a practical range around the sample estimate.

The relationship is:Margin of Error=Critical Value×Standard Error\text{Margin of Error} = \text{Critical Value} \times \text{Standard Error}Margin of Error=Critical Value×Standard Error

For a sample proportion, the standard error is:SE=p(1p)nSE = \sqrt{\frac{p(1-p)}{n}}SE=np(1−p)​​

So, the margin of error becomes:E=z×SEE = z \times SEE=z×SE

In simple terms, standard error measures variability, while margin of error turns that variability into an interpretable plus-or-minus range.


Conditions and Assumptions for Using Margin of Error

The margin of error is most useful when the sample has been selected properly and the sample size is large enough.

For a sample proportion, the following conditions are commonly used:

The sample should be randomly selected

The sample should represent the population as fairly as possible. If the sample is biased, the margin of error may give a false sense of accuracy.

Observations should be independent

One person’s response should not determine another person’s response. This helps ensure that each observation provides separate information.

The sample size should be large enough

For proportions, a common rule is:np10np \geq 10np≥10

andn(1p)10n(1-p) \geq 10n(1−p)≥10

This means the sample should have enough expected successes and failures for the normal approximation to work well.

The population should match the research question

The population you sample from should match the population you want to make conclusions about.


Common Mistakes When Using Margin of Error

Margin of error is useful, but it is often misunderstood. Here are common mistakes to avoid.

Treating the estimate as exact

A survey percentage is still an estimate. A margin of error reminds you that the true population value may be slightly lower or higher.

Ignoring the confidence level

A margin of error depends on the confidence level. A margin of error at 90% confidence is not the same as a margin of error at 95% or 99% confidence.

Forgetting finite population correction

If the population size is known and the sample is a meaningful share of that population, the finite population correction can improve the calculation.

Assuming a small margin of error removes bias

A small margin of error does not guarantee a good study. It only reflects sampling uncertainty. It does not fix biased questions, poor sampling, or low response quality.

Comparing close results too quickly

If two results are close, their confidence intervals may overlap. In that case, the difference may not be meaningful.


Calculate Margin of Error Online

You can calculate margin of error manually using the formulas above, but an online calculator is faster and reduces the chance of arithmetic mistakes.

Use our margin of error calculator to enter your confidence level, sample proportion, sample size, and population size if known.

The calculator gives you:

  • The margin of error
  • The formula used
  • The z-score used
  • A step-by-step explanation
  • A simple interpretation of the result

This is useful when you want to check your work or quickly calculate the margin of error for a survey, poll, or research study.


Frequently Asked Questions

What is margin of error?

Margin of error is a statistical value that shows how far a sample estimate may be from the true population value. It is commonly used in surveys and polls to show the uncertainty around a sample result.

What is the margin of error formula?

For a large or unknown population, the margin of error formula is:E=zp(1p)nE = z \sqrt{\frac{p(1-p)}{n}}E=znp(1−p)​​

For a known finite population, the formula is:E=zp(1p)n×NnN1E = z \sqrt{\frac{p(1-p)}{n}} \times \sqrt{\frac{N-n}{N-1}}E=znp(1−p)​​×N−1N−n​​

What does a 5% margin of error mean?

A 5% margin of error means the true population value is likely to be within 5 percentage points above or below the sample estimate. For example, 60% with a margin of error of ±5% gives a range from 55% to 65%.

How do you calculate margin of error?

To calculate margin of error, choose the correct formula, identify the confidence level, find the z-score, enter the sample proportion, and divide by the sample size as shown in the formula. If the population is finite, apply the finite population correction.

What is a good margin of error?

A margin of error of 5% or lower is commonly used in many surveys. However, the best margin of error depends on the research purpose, confidence level, sample size, and the level of precision needed.

How do I reduce the margin of error?

The most common way to reduce the margin of error is to increase the sample size. You can also improve the quality of the results by using better sampling methods and increasing response quality.

Does sample size affect margin of error?

Yes. Larger sample sizes usually reduce the margin of error, while smaller sample sizes increase it. This is because larger samples provide more information about the population.

Does population size affect margin of error?

Population size affects the margin of error mainly when the sample is large compared with the total population. If the population is very large, population size usually has only a small effect.

Is margin of error the same as standard error?

No. Standard error measures the variability of a sample estimate. Margin of error uses the standard error and a critical value to create a plus-or-minus range around the estimate.

Is margin of error the same as confidence interval?

No. Margin of error is the amount added to and subtracted from a sample estimate. The confidence interval is the full range created after applying the margin of error.

What Affects the Margin of Error?

The size of the margin of error mainly depends on three things.

  • Sample size. Sample size has a very strong effect on the margin of error. In general, larger samples reduce the margin of error, while smaller samples increase it. That is why increasing the number of respondents is one of the best ways to improve precision.
  • Confidence level. The more confident you want to be in the result, the larger the margin of error becomes. For example, a 90% confidence level gives a smaller margin of error than 95%, while 99% gives an even larger one. This happens because higher confidence requires a wider interval.
  • Sample proportion. The margin of error is usually largest when the sample proportion is close to 50% and smaller when the proportion is closer to 0% or 100%. This is why many sample size and margin of error formulas use 50% as the safest assumption when the true proportion is unknown.

What to Do When the Margin of Error is Too Large

Sometimes the calculated margin of error is larger than you want. When that happens, the most direct solution is usually to increase the sample size.

You may also improve the usefulness of the result by:

  • Collecting more responses
  • Extending the survey period
  • Improving response rates
  • Using better sampling methods
  • Targeting the right population more carefully

When to Use the Margin of Error

The margin of error is useful when:

  • You are reporting survey results
  • You are analyzing polls
  • You are estimating population proportions
  • You are building confidence intervals
  • You want to judge how precise a sample result is
  • You are comparing close sample-based percentages
  • You are interpreting research or questionnaire data

Common Mistakes When Using Margin of Error

When working with the margin of error, people often make a few common mistakes, which include:

  • Treating the estimate as exact. A survey result is still an estimate. The margin of error reminds you that a range is usually more realistic than a single fixed number.
  • Ignoring the confidence level. A margin of error always depends on the selected confidence level. If the confidence level changes, the margin of error changes too.
  • Forgetting the finite population correction. If the population is known and the sample makes up a meaningful share of it, ignoring the finite population correction can make the result less precise than it should be.
  • Assuming a small margin of error guarantees no bias. A small margin of error only reflects sampling error. It does not fix problems caused by poor sampling, low response quality, bad question wording, or nonresponse bias.
  • Comparing close results without checking overlap. Two results that look different at first may not be meaningfully different once the margin of error is taken into account.

Frequently Asked Questions

What is a margin of error?

A margin of error is a statistical value that shows how much a sample estimate may differ from the true population value.

What is the margin of error formula?

For an infinite population, the margin of error formula is E=Zα/2p(1p)nE = Z_{\alpha/2}\sqrt{\frac{p(1-p)}{n}}. However, if you’re working with a known but finite population, you should apply the finite population correction. In this case, the formula becomes: E=Zp(1p)nNnN1E = Z \sqrt{\frac{p(1-p)}{n}} \sqrt{\frac{N-n}{N-1}}.

How do I reduce the margin of error?

The most common way is to increase the sample size.

Does population size affect the margin of error?

Yes, but mainly when the sample is large relative to the population. In that case, the finite population correction reduces the margin of error.

Is the margin of error the same as the standard error?

No. Standard error measures sampling variability, while margin of error combines that variability with a confidence level to create a practical range.

What does a 5% margin of error mean?

It means the true population value is likely to be within 5 percentage points above or below the sample estimate at the chosen confidence level.

About the Author
Joseph Mburu profile picture

Joseph is an experienced Statistician and Data Analyst with over six years of hands-on work in applied statistics, data science, and quantitative research. He holds advanced degrees in Applied Statistics and Data Analytics, reflecting strong technical and academic expertise. Joseph is the founder of Stat Study Hub, a platform designed... Read more

Related Posts