Use this margin of error calculator to estimate how much your survey result may differ from the true population value. Enter your sample size, confidence level, sample proportion, and population size to calculate the margin of error instantly.
The calculator also shows the formula used, how the computation was done for your inputs, and a simple interpretation of your result.
Margin of Error Calculator
Survey ProportionCalculate the margin of error for a sample proportion using the confidence level, sample proportion, sample size, and optional population size.
Step-by-step explanation
How to Use the Margin of Error Calculator
This calculator helps you quickly find the margin of error (MOE) for a survey or sample proportion. Just follow these simple steps:
- Enter the confidence level as a percentage. For example, enter 95 for a 95% confidence level.
- Enter the sample proportion (p) as a percentage. For example, enter 50 for a 50% sample proportion.
- Enter the sample size (n) used in your survey or study.
- Enter the population size if the population is finite and you know its size. This field is optional.
- Click Calculate
The calculator instantly returns the margin of error for your study, along with a clear, step-by-step explanation of how it was computed for your inputs.
Tip. If you are not sure what sample proportion to use, use the default 50%. This gives the most conservative margin of error because it assumes the highest level of variability in the population.
Formula Used by This Calculator
This calculator uses the standard margin of error formula for a sample proportion. This is the same formula relationship used in Cochran’s sample size formula, but here it is rearranged to calculate the margin of error instead of the required sample size.
Therefore, if the population size is unknown and infinite, this calculator uses the following margin of error formula:
Where:
- e is the margin of error
- z is the z-score for the selected confidence level
- p is the sample proportion
- n is the sample size
Note. The z-score depends on the confidence level you choose. For example, a 95% confidence level uses a z-score of approximately 1.96. You can also find the z-score for any other confidence level using our free z critical value calculator.
However, if the population size is known (finite population), this calculator applies the finite population correction and returns the adjusted margin of error. The adjusted margin of error formula used in this case is:
Where:
- N = population size
- n = sample size
Note: The finite population correction is mainly useful when your sample makes up a noticeable share of the total population. For example, surveying 400 people from a population of 1,000 is different from surveying 400 people from a population of 1,000,000. When the population is very large compared with the sample size, the correction has little effect on the margin of error.
How to Find the MOE Using the Calculator: Examples
The examples below show how to use the calculator to find the margin of error for a sample proportion. The first example assumes the population is very large or unknown, while the second example shows how the calculation changes when the population size is known and finite.
Example 1. Margin of Error when Population is Infinite
Suppose a school wants to estimate the percentage of students who prefer online revision materials. The school surveys 625 students and wants to use a 95% confidence level. Since the expected sample proportion is not known in advance, the researcher uses 50% as the sample proportion. Calculate the margin of error for this study.
Solution
From the question, we know that:
- Confidence level = 95%
- Sample proportion, p = 50%
- Sample size, n = 625
- Population size is unknown. Thus, we assume it is infinite
To find the MOE using the calculator, follow these steps:
- Enter 95 in the confidence level field for the 95% confidence level
- Enter 50 in the sample proportion field for the 50% proportion
- Enter 625 in the sample size input field
- Leave the optional population field blank
- Click Calculate
The calculator returns the margin of error of approximately ±3.92%, as shown below.
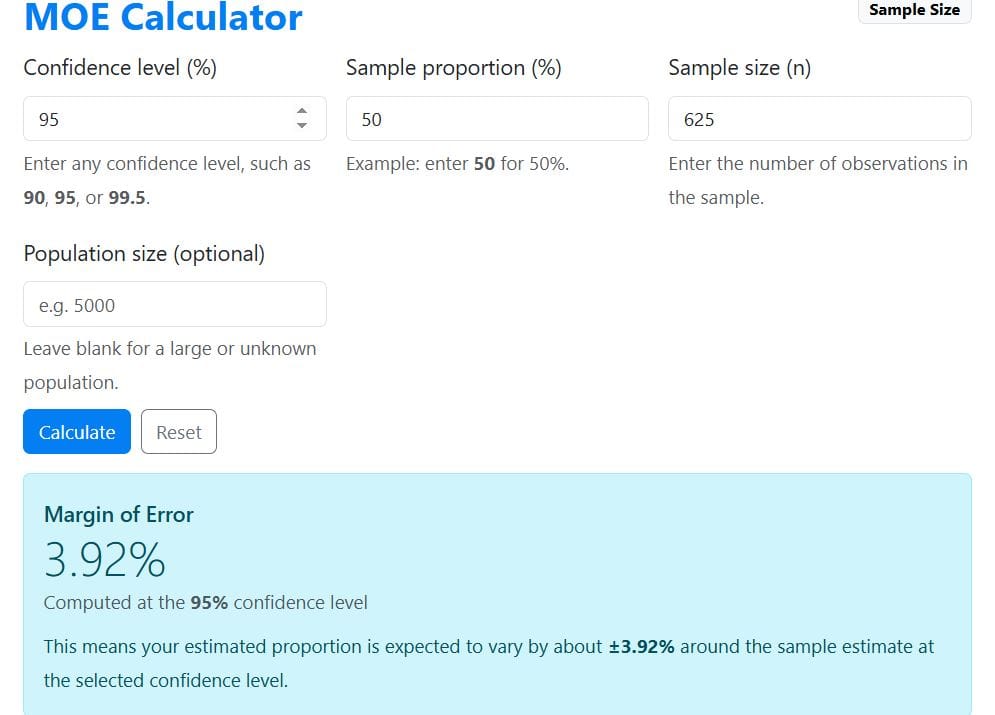
This means that the survey result may be about 3.92 percentage points lower or higher than the actual population value.
Example 2. Margin of Error When the Population Size Is Known (Finite)
Suppose a company wants to estimate the percentage of employees who are satisfied with a new remote work policy. The company has 1,200 employees in total. A survey is sent out, and 300 employees respond. The researcher wants to use a 95% confidence level. Since the expected sample proportion is not known in advance, the researcher uses 50% as the sample proportion. Calculate the margin of error for this study.
Solution
From the question, we know that:
- Confidence level = 95%
- Sample proportion, p = 50%
- Sample size, n = 300
- Population size, N = 1,200
To find the MOE using the calculator, follow these steps:
- Enter 95 in the confidence level field for the 95% confidence level.
- Enter 50 in the sample proportion field for the 50% proportion.
- Enter 300 in the sample size input field.
- Enter 1200 in the population size field.
- Click Calculate.
The calculator returns a margin of error of approximately ±4.90%, as shown below.
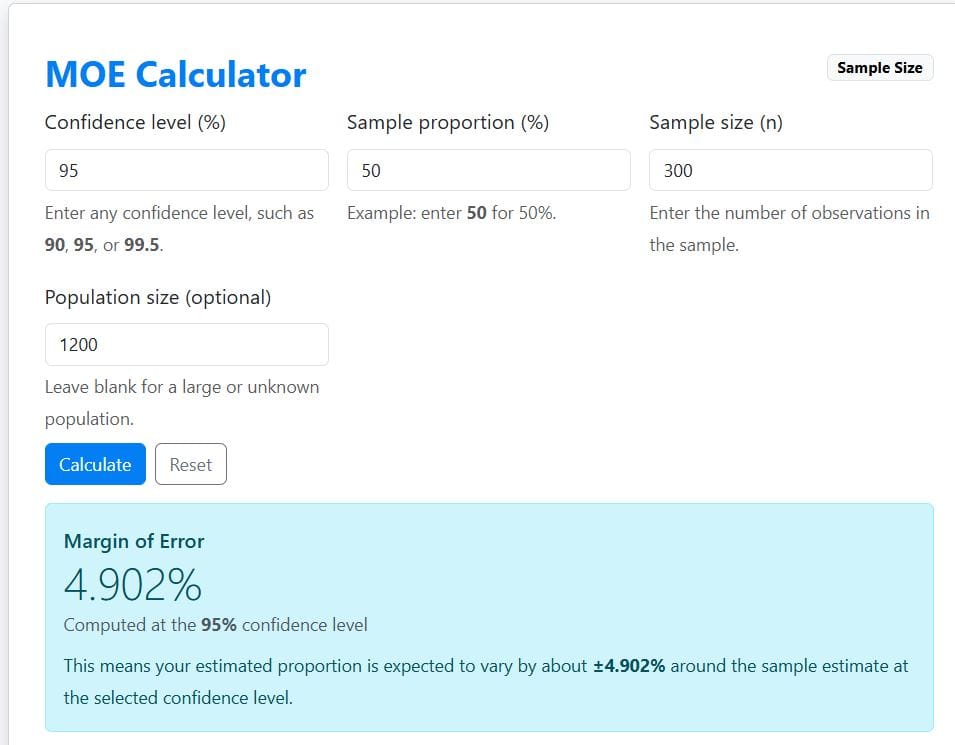
This means that the survey result may be about 4.90 percentage points lower or higher than the actual percentage of satisfied employees in the company.
For a full manual explanation of the formula and calculation steps, read our guide on what margin of error means and how to calculate it.
How to Interpret Margin of Error Results
The MOE tells you how much your sample result may differ from the true population value. It is usually written with the plus-or-minus symbol (±), such as ±5%.
For example, suppose a survey shows that 60% of respondents support a new policy. If the margin of error is ±5%, the true population value may be about 5 percentage points lower or higher than the survey result.
That means the likely range is:
- 60%−5% = 55%
- 60%+5% = 65%
As such, the result can be interpreted as 60% ±5%, or approximately 55% to 65%.
Tip. A smaller margin of error means your estimate is more precise, whereas a larger margin of error means there is more uncertainty around the result.
When to Use this Calculator
You can use this MOE calculator when you want to estimate the precision of a percentage-based result.
It is especially useful for:
- Survey results
- Opinion polls
- Market research studies
- Customer feedback surveys
- Academic questionnaires
- Public health surveys
- Political polling
- Business research
- Social science research
For example, if you collect survey responses from a sample of customers, this calculator can help you estimate how close your sample percentage may be to the true percentage in the entire customer population.
Frequently Asked Questions
This is an online tool that estimates how much a sample result may differ from the true population value. It uses the confidence level, sample proportion, sample size, and population size to calculate the margin of error.
A margin of error of 5% or lower is commonly used in many surveys. However, the best margin of error depends on your research purpose, sample size, confidence level, and how precise your results need to be.
A sample proportion of 50% gives the largest margin of error. This makes it a conservative choice when you do not know the expected proportion in advance.
Yes. A larger sample size usually reduces the margin of error because the estimate is based on more observations. However, the improvement becomes smaller as the sample size continues to increase.
Yes. This calculator is especially useful for survey results, opinion polls, market research, and questionnaire-based studies where results are reported as percentages.