Use this p value calculator to find a p-value from a z score, t statistic, chi-square statistic, F statistic, or Pearson correlation coefficient. Select the test statistic you have, choose the correct tail, enter the required values, and click Calculate.
The calculator will return the p-value, compare it with your chosen significance level, and show a clear step-by-step explanation. This makes it useful for hypothesis testing, statistics homework, and research projects.
Calculate a P-Value From a Test Statistic
Hypothesis TestingChoose the test statistic you have, enter the required values, and calculate the p-value for z, t, chi-square, F, or Pearson correlation results.
Step-by-step explanation
How to Use This P Value Calculator
Want to quickly find the correct p-value for your hypothesis tests using this tool? Just follow these simple steps:
- Select the test statistic type. Please specify the distribution of your hypothesis test here. The calculator allows you to switch between z-score (for z-tests), t-statistic, chi-square statistic, F-statistic, and Pearson’s correlation.
- Choose the tail of your hypothesis test. The calculator allows you to specify whether the test is a left-tailed, right-tailed, or two-tailed test
- Enter the test statistic. Based on the distribution you’re working with, you should type the test statistic in the input field.
- Enter the required degrees of freedom or sample size. Some tests may require you to enter the degrees of freedom or sample size. This changes based on the distribution you select.
- Enter the significance level. The most common significance level is 0.05. However, the calculator allows you to enter a different level based on your hypothesis test question.
- Click Calculate. The calculator will instantly return the correct p-value for your test and tell you whether to reject or fail to reject the null hypothesis based on your significance level.
In addition to the p-values, the calculator provides a clear, step-by-step explanation of how the p-value was calculated for your hypothesis test. This approach ensures that you not only get the correct p-value for your test but also learn how to find it.
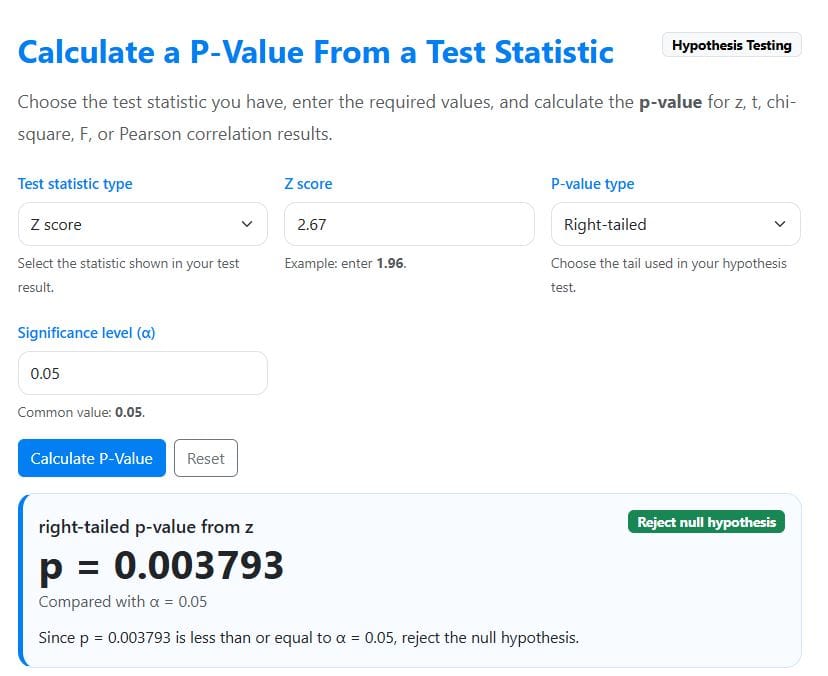
Example 1: P-Value From a Z Score
Suppose a researcher conducts a right-tailed z test and obtains the following result:
- Test statistic: z = 2.67
- Test type: Right-tailed
- Significance level: α = 0.05
Find the p-value.
Solution
To find the p-value corresponding to the z test using the calculator, follow these steps:
Step 1: Select the test statistic
Since the result gives a z score, choose Z score as the test statistic type
Step 2: Enter the required values
Enter:
- z score = 2.67
- P-value type = Right-tailed
- Significance level = 0.05
Step 3: Click Calculate
The calculator will instantly return the correct p-value as 0.003793. In this case, it will also tell you to reject the null hypothesis since the p-value (0.003793) is less than the significance level (0.05). The results are shown below.
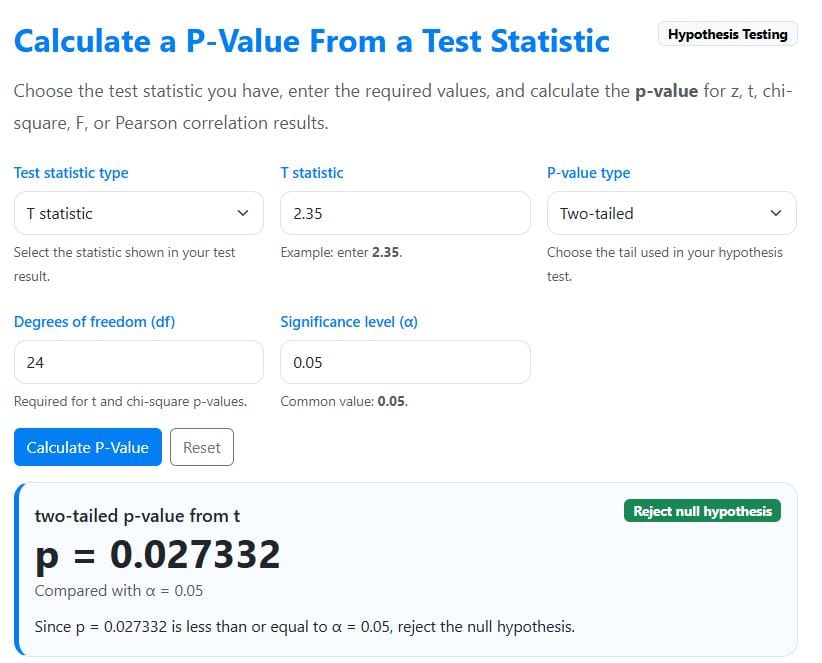
Example 2: P-Value From a T Statistic
Suppose a researcher tests whether a training program changes employees’ average productivity score. The test gives the following result:
- Test statistic: t = 2.35
- Degrees of freedom: df = 24
- Test type: Two-tailed
- Significance level: α = 0.05
Find the p-value.
Solution
To find the t-test p-value using the calculator, follow these steps:
Step 1: Select the test statistic
Since the result gives a t statistic, choose the T statistic as the Test Statistic Type
Step 2: Enter the required values
In the calculator input fields, enter:
- t statistic = 2.35
- P-value type = Two-tailed
- Degrees of freedom = 24
- Significance level = 0.05
Step 3: Click the Calculate button
The calculator will instantly return the correct p-value for the test as 0.027332. By comparing this p-value with the significance level (0.05), the calculator will tell you to reject the null hypothesis. The results are shown below.
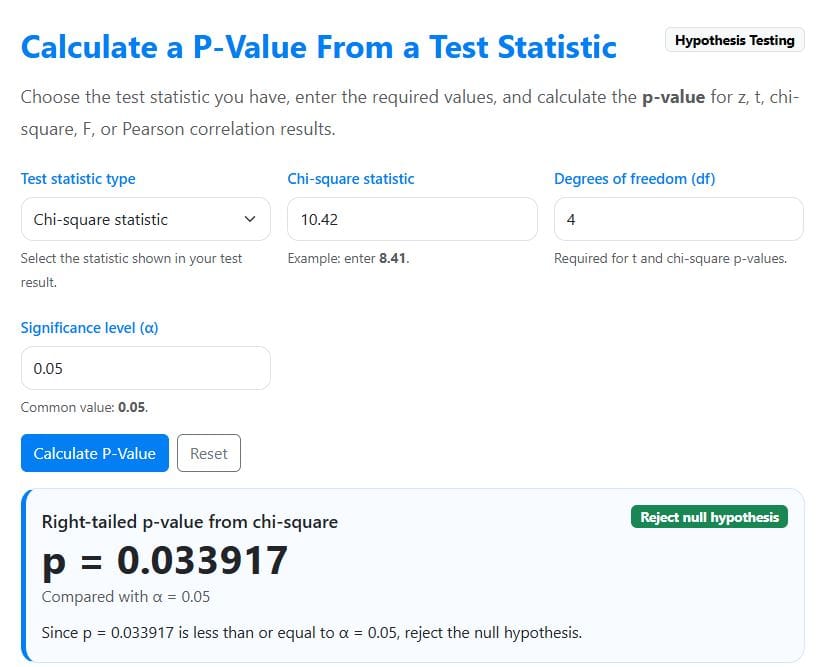
Example 3: P-Value From a Chi-Square Statistic
Suppose a researcher conducts a chi-square test of independence and obtains the following result:
- Test statistic: χ² = 10.42
- Degrees of freedom: df = 4
- Significance level: α = 0.05
Find the p-value.
Solution
To find the p-value for the chi-square test using the calculator, follow these steps:
Step 1: Select the test statistic
Since the result gives a chi-square statistic, choose the chi-square statistic as the Test Statistic Type
Step 2: Enter the required values
In the calculator input fields, enter:
- Chi-square statistic = 10.42
- Degrees of freedom = 4
- Significance level = 0.05
Step 3: Click the Calculate button
The calculator will instantly return the correct p-value as 0.033917. It will also compare the p-value with the significance level (0.05) and indicate that you should reject the null hypothesis. The results will be as shown below.
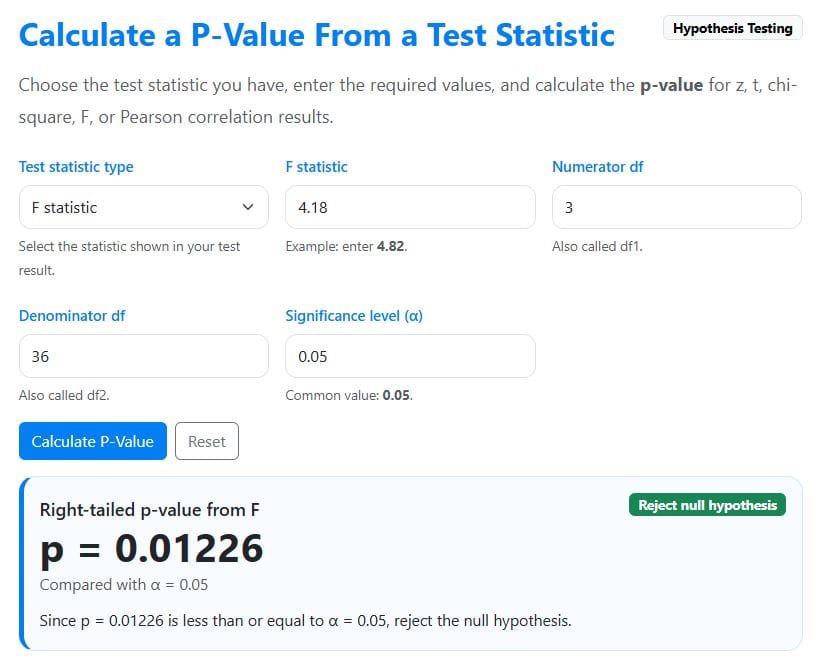
Example 4: P-Value From an F Statistic
Suppose a researcher runs a one-way ANOVA and obtains the following result:
- Test statistic: F = 4.18
- Numerator degrees of freedom: df₁ = 3
- Denominator degrees of freedom: df₂ = 36
- Significance level: α = 0.05
Find the p-value.
Solution
To find the p-value for the ANOVA’s F-test using the calculator, follow these steps:
Step 1: Select the test statistic
Since the result gives an F statistic, choose the F statistic as the Test Statistic Type
Step 2: Enter the required values
In the calculator input fields, enter:
- F statistic = 4.18
- Numerator degrees of freedom = 3
- Denominator degrees of freedom = 36
- Significance level = 0.05
Step 3: Click the Calculate button
The calculator will instantly return the p-value for the test as 0.01226. It will then tell you to reject the null hypothesis since the p-value (0.01226) is less than the significance level. The results will be as shown below.
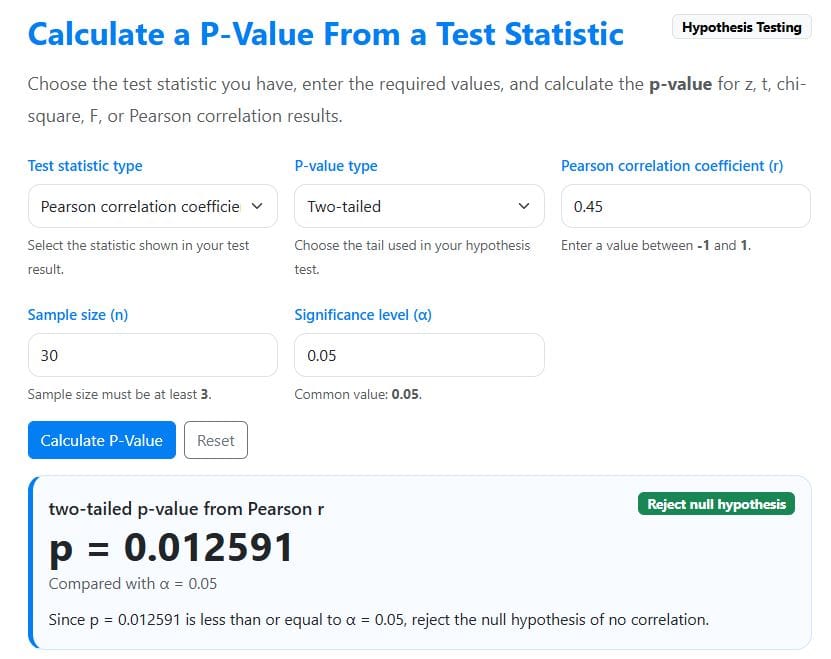
Example 5: P-Value From Pearson’s Correlation Coefficient
Suppose a researcher examines the relationship between study time and exam scores. The correlation result is:
- Pearson correlation coefficient: r = 0.45
- Sample size: n = 30
- Test type: Two-tailed
- Significance level: α = 0.05
Find the p-value.
Solution
To find the correct p-value for Pearson’s correlation test using the calculator, follow these steps:
Step 1: Select the test statistic
Since the result gives Pearson’s correlation coefficient, choose Pearson’s correlation coefficient as the Test Statistic Type
Step 2: Enter the required values
In the calculator input fields, enter:
- P-value type = Two-tailed
- Pearson’s r = 0.45
- Sample size (n) = 30
- Significance level = 0.05
Step 3: Click the calculate button
The calculator will instantly return the correct p-value for the correlation as 0.012591. It will also tell you to reject the null hypothesis since the p-value (0.012591) is less than the 0.05 significance level. The results will be as shown below.
Which Test Statistic Should You Choose?
The correct option depends on the statistic shown in your hypothesis test result. Use the table below as a quick guide.
| If your result shows | Choose this option | Commonly used for |
|---|---|---|
| z or z-score | Z score | Z tests, large-sample tests, and proportion tests |
| t | T statistic | One-sample, paired, and independent samples t tests |
| χ² or chi-square | Chi-square statistic | Goodness-of-fit tests, tests of independence, and tests of homogeneity |
| F | F statistic | ANOVA, regression F tests, and variance tests |
| r | Pearson correlation coefficient | Testing whether a correlation is statistically significant |
Each test statistic follows a different probability distribution. That is why it is important to select the correct statistic type before calculating the p-value.
How to Choose Left-Tailed, Right-Tailed, or Two-Tailed
The tail you choose should match your alternative hypothesis. If you choose the wrong tail, the p-value may not match your hypothesis test.
Two-Tailed P-Value
Use a two-tailed p-value when your alternative hypothesis says the value is different from the null value, without saying whether it is higher or lower.
For example:
- H₁: μ ≠ 50
- H₁: p ≠ 0.40
- H₁: r ≠ 0
A two-tailed test checks for evidence in both directions.
Right-Tailed P-Value
Use a right-tailed p-value when your alternative hypothesis says the value is greater than the null value.
For example:
- H₁: μ > 50
- H₁: p > 0.40
- H₁: variance > 25
A right-tailed test checks for unusually large values of the test statistic.
Left-Tailed P-Value
Use a left-tailed p-value when your alternative hypothesis says the value is less than the null value.
For example:
- H₁: μ < 50
- H₁: p < 0.40
- H₁: variance < 25
A left-tailed test checks for unusually small values of the test statistic.
What Is a P-Value?
A p-value is the probability of getting a result as extreme as the one observed, assuming the null hypothesis is true.
In hypothesis testing, the p-value helps you decide whether the observed result is unusual enough to reject the null hypothesis. A small p-value means the result would be unlikely if the null hypothesis were true. On the other hand, a large p-value means the result is not unusual enough to reject the null hypothesis.
How to Interpret a P-Value
The most common rule is to compare the p-value with your chosen significance level, α. The decision is as follows:
- Reject the null hypothesis (H0) if the p-value is less than the significance level, α. You should conclude that the results are statistically significant.
- Fail to reject the null hypothesis (H0) if the p-value is greater than the significance level (α). In this case, the results are statistically insignificant.
For example, assuming the significance level for your hypothesis test is 0.05, you should make the following decision and interpretation.
- If p ≤ 0.05, we reject H0 and conclude that the results are statistically significant.
- If p > 0.05, we fail to reject H0 and conclude that the results are not statistically significant.
For example, if your p-value is 0.032 and you’re testing the hypothesis at a 0.05 significance level, you would reject the null hypothesis (H0) since the p-value (0.032) is less than 0.05. This means the result is statistically significant at the 5% level.
However, if the p-value was 0.184 and assuming a 0.05 significance level, you would fail to reject the null hypothesis (H0) since the p-value (0.184) is greater than 0.05. This would mean that the result is not statistically significant at the 5% significance level.
P-Value vs Critical Value
A p-value and a critical value are both used in hypothesis testing, but they work in different ways.
With the p-value approach, you compare the p-value with the significance level. However, with the critical value approach, you compare the test statistic with a critical value.
Both methods should lead to the same conclusion when used correctly.
If you prefer the critical value method, you can use these related calculators:
- Z Critical Value Calculator
- T Critical Value Calculator
- Chi-Square Critical Value Calculator
- F Critical Value Calculator
Common Mistakes When Using a P-Value Calculator
Here are common mistakes to avoid when calculating a p-value using our online calculator.
- Choosing the Wrong Test Statistic. Do not enter a t statistic as a z score or a chi-square statistic as an F statistic. Each statistic uses a different distribution, and the selected option must match your result.
- Using the Wrong Tail. The p-value type should match your alternative hypothesis. Use two-tailed for “different,” right-tailed for “greater than,” and left-tailed for “less than.”
- Forgetting Degrees of Freedom. T, chi-square, and F p-values depend on degrees of freedom. If the degrees of freedom are incorrect, the p-value will also be incorrect.
- Treating p < 0.05 as Proof. A statistically significant p-value does not prove that the alternative hypothesis is true. It only shows that the observed result is unlikely under the null hypothesis.
- Ignoring Effect Size. A result can be statistically significant but still have a small practical effect. Always consider the size and meaning of the effect, not just the p-value.
- Rounding Too Early. Use the full test statistic when possible. Rounding too early can slightly change the p-value, especially when the result is close to the significance level.
Frequently Asked Questions
This is an online tool that calculates the p-value from a test statistic. It helps you to quickly find p-values from z scores, t statistics, chi-square statistics, F statistics, and Pearson correlation coefficients.
Choose the option that matches the statistic shown in your result. Use z for a z score, t for a t statistic, chi-square for χ², F for an F statistic, and Pearson’s r for a correlation coefficient.
Use a two-tailed p-value when your alternative hypothesis says the result is different. If you’re testing whether the value is greater than the null value, use a right-tailed p-value. However, if testing whether the value is less than the null value, you should use a left-tailed p-value.
A p-value less than 0.05 means the result is statistically significant at the 5% significance level. It suggests that the observed result would be unlikely if the null hypothesis were true.
Not always. A smaller p-value gives stronger evidence against the null hypothesis, but it does not tell you whether the effect is large, important, or useful in practice.
The p-value is calculated from your data, while the alpha, or the significance level, is the cutoff you choose before the test. If the p-value is less than or equal to alpha, the result is statistically significant.