
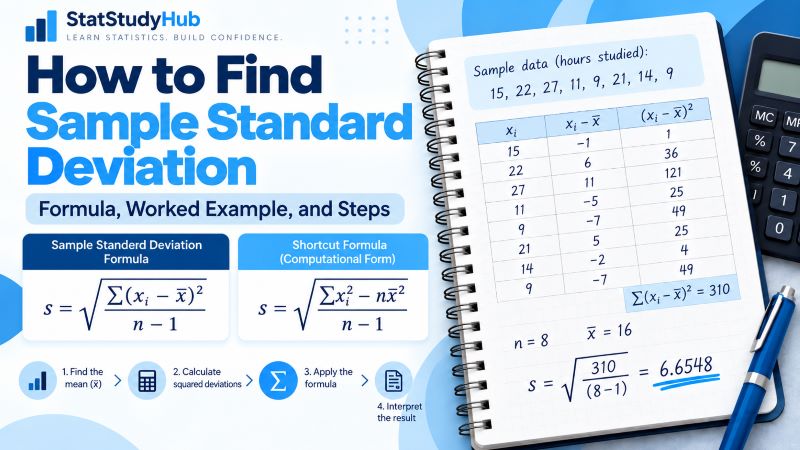
Sample standard deviation measures how spread out the values in a sample are around the sample mean. It is used when your observations represent only part of a larger population. In this guide, you’ll learn the sample standard deviation symbol and formula, and how to find sample standard deviation by hand in 4 simple steps. We’ll also work through a clear example and show how to get the same answer using the shortcut formula.
What Is Sample Standard Deviation?
Sample standard deviation is a measure of how much the observations in a sample vary around the sample mean.
A small sample standard deviation means the values tend to be close to the sample mean. However, a larger value means the observations are more spread out.
For example, suppose two samples have the same mean. If the values in the first sample are clustered closely around the mean, while those in the second sample are more spread out, the second sample will have a larger standard deviation.
Sample Standard Deviation Formula and Symbol
The sample standard deviation symbol is s. Its formula is:
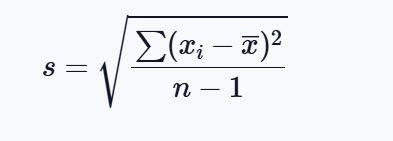
Where:
- s is the sample standard deviation
- xᵢ denotes each value in the sample
- x̄ is the sample mean
- n is the sample size
- Σ(xᵢ − x̄)² represents the sum of squared deviations from the sample mean
Notice that the denominator is n − 1, rather than n.
This is one of the main differences between the sample and population standard deviation formulas.
How to Find Sample Standard Deviation by Hand
To find the sample standard deviation manually, follow these 4 steps:
- Find the sample mean.
- Find the deviations from the sample mean and square the differences
- Sum the squared deviations.
- Apply the sample standard deviation formula.
Example
A researcher selects 8 students from a larger university class and records the number of hours they studied during a particular week: 15, 22, 27, 11, 9, 21, 14, 9
Find the sample standard deviation.
Solution
Since the 8 students were selected from a larger class, the observations represent a sample.
To find the standard deviation of the sample data manually, follow these steps:
Step 1. Find the sample mean
The sample mean formula is: x̄ = Σxᵢ / n
In this case, Σxᵢ = 15 + 22 + 27 + 11 + 9 + 21 + 14 + 9
= 128
There are 8 observations. Hence, n = 8
Substituting the values:
x̄ = 128 / 8
= 16
You can also use our sample mean calculator to verify the above result.
Step 2. Find the deviations from the mean and square them
Since x̄ = 16, we find the deviations by subtracting the mean (16) from each observation. We then square each of the deviations.
The table below shows the complete process.
| xᵢ | xᵢ − x̄ | (xᵢ − x̄)² |
|---|---|---|
| 15 | 15 − 16 = −1 | (−1)² = 1 |
| 22 | 22 − 16 = 6 | 6² = 36 |
| 27 | 27 − 16 = 11 | 11² = 121 |
| 11 | 11 − 16 = −5 | (−5)² = 25 |
| 9 | 9 − 16 = −7 | (−7)² = 49 |
| 21 | 21 − 16 = 5 | 5² = 25 |
| 14 | 14 − 16 = −2 | (−2)² = 4 |
| 9 | 9 − 16 = −7 | (−7)² = 49 |
Step 3. Sum the squared deviations
Adding all the squared deviations, Σ(xᵢ − x̄)² = 1 + 36 + 121 + 25 + 49 + 25 + 4 + 49
= 310
Therefore, Σ(xᵢ − x̄)² = 310
Step 4. Apply the sample standard deviation formula
Recall. The sample standard deviation formula is: s = √[Σ(xᵢ − x̄)² / (n − 1)]
From the previous steps:
- Σ(xᵢ − x̄)² = 310
- n = 8
Substituting the values, we get: s = √[310 / (8 − 1)]
= √(310 / 7)
= √44.2857
s = 6.6548
Therefore, the sample standard deviation is: s = 6.6548. You can verify the result using our sample standard deviation calculator.
Alternative Sample Standard Deviation Formula
You may also come across another formula for finding the sample standard deviation:
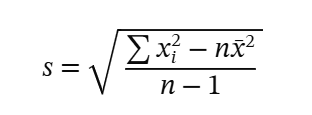
This is sometimes called the shortcut formula or computational formula.
Let’s use the same data to see whether they both yield the same result.
From the example, the data is: 15, 22, 27, 11, 9, 21, 14, 9
We already found that:
- n = 8
- x̄ = 16
We only need to find the sum of squares, Σxᵢ², which we can compute it manually as follows:
Σxᵢ² = 15² + 22² + 27² + 11² + 9² + 21² + 14² + 9²
= 225 + 484 + 729 + 121 + 81 + 441 + 196 + 81
= 2358
Recall. The shortcut sample standard deviation formula is: s = √[(Σxᵢ² − nx̄²) / (n − 1)]
Substituting the values, s = √[(2358 − 8(16²)) / (8 − 1)]
= √[(2358 − 2048) / 7]
= √44.2857
s = 6.6548
Therefore, the sample standard deviation is: s = 6.6548
This is the same result we obtained using the standard sample standard deviation formula.
Therefore, you can use either formula to get the sample standard deviation. However, the shortcut formula can be useful when you already have the sum of the squared values, the sample mean, and the sample size.
Why Do We Divide by n − 1?
When calculating sample standard deviation, we divide by n − 1 instead of n. This is because the sample is being used to estimate variability in a larger population. Using n − 1 helps correct the tendency of a sample to underestimate the population variance, an adjustment commonly known as Bessel’s correction.
Sample vs Population Standard Deviation
Sample and population standard deviation both measure the spread of values around the mean. The main difference is the type of data used.
| Feature | Sample Standard Deviation | Population Standard Deviation |
|---|---|---|
| Data used | Sample from a larger population | Entire population |
| Symbol | s | σ |
| Mean | x̄ | μ |
| Number of observations | n | N |
| Denominator | n − 1 | N |
If your data include the entire population and you want to learn how to find the standard deviation manually, our complete guide on how to find population standard deviation might be useful.
How to Interpret Sample Standard Deviation
Sample standard deviation tells you how spread out the observations are around the sample mean.
- A small sample standard deviation means the values tend to be close to the mean.
- A large sample standard deviation means the values are more spread out.
- A sample standard deviation of 0 means all observations in the sample have the same value.
Standard deviation is expressed in the same units as the original data.
For example, if the data are measured in kilograms, the standard deviation is also measured in kilograms.
There is no single value that is always considered a high or low standard deviation. You need to interpret the result based on the scale and context of your data.
Frequently Asked Questions
To find sample standard deviation manually:
1) Find the sample mean.
2) Subtract the mean from each observation and square each result.
3) Add the squared deviations.
4) Divide the sum of squared deviations by n − 1.
5) Take the square root of the result.
The sample standard deviation formula is: s = √[Σ(xᵢ − x̄)² / (n − 1)]. You may also use the shortcut formula: s = √[(Σxᵢ² − nx̄²) / (n − 1)]. Both formulas give the same sample standard deviation when applied correctly.
The sample standard deviation symbol is s.
If you already have your data and only need the answer, use our sample standard deviation calculator. You can enter or paste your values to get the sample standard deviation together with the related statistics and a clear step-by-step solution.
