
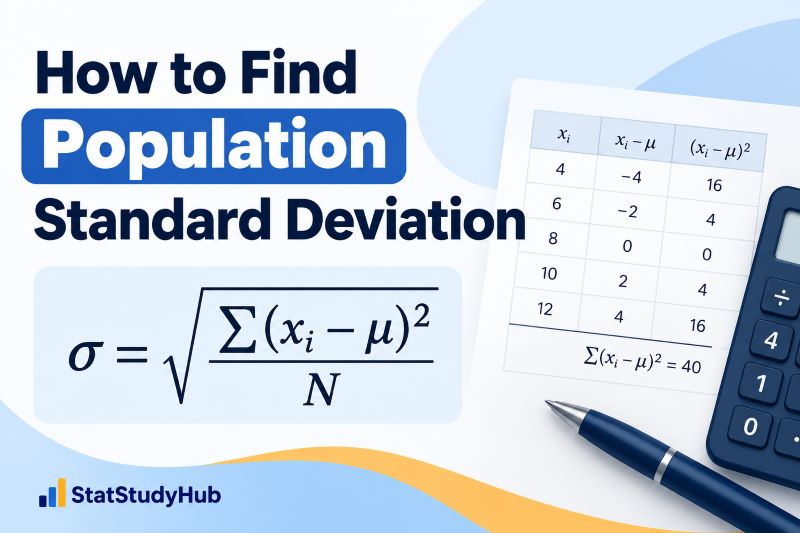
Population standard deviation measures how spread out all values in a population are around the population mean. It is used when your data include every member, item, score, or observation in the group you want to study.
In this guide, you’ll learn what the population standard deviation is, its symbol and formula, and how to find population standard deviation by hand in 4 simple steps. We’ll also work through a clear example and look at the difference between population and sample standard deviation.
What Is Population Standard Deviation?
Population standard deviation is a measure of variability. It tells you how spread out the values in an entire population are around the population mean.
A smaller standard deviation means the values tend to be closer to the mean, while a larger standard deviation means the values are more spread out.
For example, suppose two classes have the same average test score of 75. In one class, most students score close to 75. In the other class, the scores range from very low to very high. Although the two classes have the same mean, the second class will have a larger standard deviation because its scores are more spread out.
Population Standard Deviation Symbol and Formula
The population standard deviation symbol is the Greek letter σ, pronounced sigma. Its formula is:
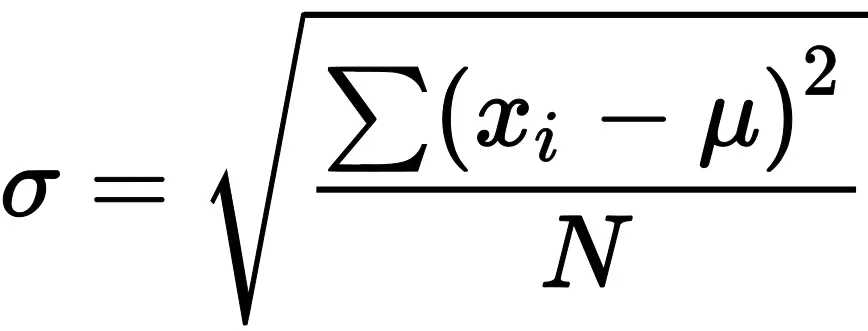
Where:
- σ = population standard deviation
- xᵢ = each value in the population
- μ = population mean
- N = total number of observations in the population
- Σ(xᵢ − μ)² = sum of squared deviations from the population mean
The formula may look complicated at first, but the calculation becomes easier when you break it into a few steps.
How to Find Population Standard Deviation by Hand
To find the population standard deviation manually, follow these 4 steps:
- State the population standard deviation formula.
- Find the population mean.
- Find the sum of squared deviations from the population mean.
- Apply the population standard deviation formula
Example
A professor records the number of practice exercises completed by all 5 students in a small tutorial group:
4, 6, 8, 10, 12
Find the population standard deviation.
Solution
To find the population standard deviation for the above data by hand, follow these steps:
Step 1. State the population standard deviation formula
Recall that the population standard deviation formula is σ = √[Σ(xᵢ − μ)² / N]
To use the formula, we need to find the population mean, the sum of squared deviations from the mean, and the population size.
Step 2. Find the population mean
By definition, the population mean formula is: μ = Σxᵢ/N
Substituting the values into the formula, we get:
μ = (4 + 6 + 8 + 10 + 12)/5
= 40/5
= 8
You can also use our population mean calculator to find or check the mean of your population data. You may also find our guide on how to find the population mean by hand useful.
Step 3. Find the sum of squared deviations from the population mean
To find the sum of squared deviations from the population mean, we need to subtract the population mean value in step 2, from each value, square the result, and sum the squares.
The table below shows how to find the squared deviations from the population mean, μ = 8.
| xᵢ | xᵢ − μ | (xᵢ − μ)² |
|---|---|---|
| 4 | 4 − 8 = −4 | (−4)² = 16 |
| 6 | 6 − 8 = −2 | (−2)² = 4 |
| 8 | 8 − 8 = 0 | 0² = 0 |
| 10 | 10 − 8 = 2 | 2² = 4 |
| 12 | 12 − 8 = 4 | 4² = 16 |
Adding the squared deviations, we get:
Σ(xᵢ − μ)² = 16 + 4 + 0 + 4 + 16
= 40
Therefore, Σ(xᵢ − μ)² = 40
Step 4. Apply the formula
Recall the population standard deviation formula is: σ = √[Σ(xᵢ − μ)² / N]
From the previous steps:
- Σ(xᵢ − μ)² = 40
- N = 5
Substituting these values into the formula: σ = √(40 / 5)
= √8
= 2.8284
Therefore, the population standard deviation is: σ = 2.8284. You can quickly verify this result using the population standard deviation calculator.
When to Use Population Standard Deviation?
Use population standard deviation when your data include every observation in the population you want to describe.
For example, you can use it to find the standard deviation of:
- Test scores of every student in a class
- Salaries of all employees in a small company
- Ages of every member of a particular team
- Daily sales for every day in a particular month
- Measurements of every product in a small production batch
The important thing is how you define your population.
For example, suppose a basketball team has 12 players, and you want to study the heights of players on that team. If you have the height of all 12 players, those values represent the entire population for your study. However, if you select 12 players from all basketball players in a league, those players are only a sample from a larger population.
Population vs Sample Standard Deviation
Population and sample standard deviation both measure how spread out values are around the mean. However, they are used for different types of data.
| Feature | Population Standard Deviation | Sample Standard Deviation |
|---|---|---|
| Data used | Entire population | Sample from a larger population |
| Symbol | σ | s |
| Mean | μ | x̄ |
| Number of observations | N | n |
| Denominator | N | n − 1 |
The main difference in the calculation is the denominator. For population standard deviation, divide the sum of squared deviations by N, whereas for sample standard deviation, divide by n − 1.
If your observations represent only part of a larger population, use our sample standard deviation calculator instead.
How to Interpret Population Standard Deviation
Population standard deviation should be interpreted in relation to the values in your dataset.
- A small standard deviation means the observations are relatively close to the population mean.
- A large standard deviation means the observations are more spread out.
- If the population standard deviation is 0, all observations in the population have the same value.
Standard deviation is also expressed in the same units as the original data.
For example, if you calculate the standard deviation of heights measured in inches, the standard deviation is also measured in inches.
There is no single value that can always be considered a high or low standard deviation. You need to consider the scale and context of the data.
Common Mistakes When Finding Population Standard Deviation
Population standard deviation involves several calculations, so small mistakes can affect the final answer.
Here are some common mistakes to avoid:
- Using sample data as population data. Make sure your observations include the entire population you want to study.
- Using n − 1 instead of N. Population standard deviation divides by N. The n − 1 denominator is used for sample standard deviation.
- Using the wrong mean. Population standard deviation uses the population mean, μ.
- Forgetting to square the deviations. Each deviation from the mean should be squared before they are added.
- Adding the deviations instead of the squared deviations. You need Σ(xᵢ − μ)², not Σ(xᵢ − μ).
- Forgetting the square root. The final step is to take the square root after dividing the sum of squared deviations by N.
Frequently Asked Questions
To find population standard deviation by hand:
1) Find the population mean.
2) Subtract the mean from each observation and square each result.
3) Add all the squared deviations.
4) Divide the sum by the population size, N.
5) Take the square root of the result.
The population standard deviation symbol is σ, which is pronounced sigma.
For population standard deviation, divide the sum of squared deviations by N. The n − 1 denominator is used when calculating sample standard deviation.
If you already have your data and only need the result, use our population standard deviation calculator. Enter or paste your values to get the population standard deviation and a step-by-step solution.
