A one-proportion z-test is one of the hypothesis tests used to determine whether a sample proportion is significantly different from a hypothesized population proportion. It is suitable when the outcome has two possible categories, such as Yes/No, Pass/Fail, Success/Failure, Defective/Non-defective, etc.
For example, suppose a company claims that 80% of customers are satisfied with its service. You can take a sample of customers and use a one-proportion z-test to determine whether the sample evidence supports or challenges that claim.
In this article, you’ll learn what the one-sample proportion test is, when to use it, its formula, assumptions, and how to perform the hypothesis test by hand.
Already know the formula behind it and just want a quick way to perform the hypothesis and learn from an example? Use our one-proportion z-test calculator to get instant results (z statistic, p-value, decision, and conclusion) and a clear, step-by-step explanation.
What Is a One Proportion Z-Test?
A one-proportion z-test, or one-sample proportion test, is a hypothesis test used to determine whether an observed sample proportion (p̂) differs significantly from the hypothesized population proportion (p0). It is mainly used for categorical data with binary outcomes (e.g., yes/no, pass/fail)
The sample proportion is denoted by p̂, which is read as p-hat, while the hypothesized population proportion is denoted by p0.
In other words, this hypothesis test aims to answer the following research question:
Is the sample proportion far enough from the hypothesized proportion to be considered statistically significant?
For example, suppose a school claims that 75% of its students pass a certain exam. A researcher samples students and finds that 68% passed. The sample proportion is different from 75%, but the question is whether the difference is large enough to reject the school’s claim. In this case, a one-sample proportion test is the most appropriate test.
When to Use a One-Sample Proportion Z-Test
A one-sample proportion test is suitable when you want to test a claim about one population proportion. However, if working with two sample proportions, you should use the two-sample proportion test.
Therefore, you should use this test whenever:
- You have one sample.
- The outcome has two categories.
- You want to compare the sample proportion with a hypothesized value.
- The observations are independent.
- The sample size is large enough for the normal approximation.
The table below shows some example questions that you can address using the one-proportion test.
| Research Question | Hypothesized Proportion |
|---|---|
| Is the pass rate different from 80%? | p0=0.80 |
| Is the defect rate less than 5%? | p0=0.05 |
| Is the support rate greater than 50%? | p0=0.50 |
| Is the satisfaction rate different from 70%? | p0=0.70 |
Recall. The outcome must have only two possible results.
Hypotheses
The null hypothesis in a one-sample proportion z test is:
- H0: p = p0 (the population proportion is equal to the hypothesized population proportion, p0)
However, the alternative hypothesis varies according to the type of test you’re conducting (right-tailed, left-tailed, or two-tailed). Thus, the alternative hypothesis for each of the tests is:
- Two-Tailed Test. H1: p ≠ p0 (The population proportion is statistically different from the hypothesized value)
- Right-Tailed Test. H1: p > p0 (The population proportion is greater than the hypothesized value)
- Left-Tailed Test. H1: p < p0 (The population proportion is less than the hypothesized value).
One-Sample Proportion Z Test Formula
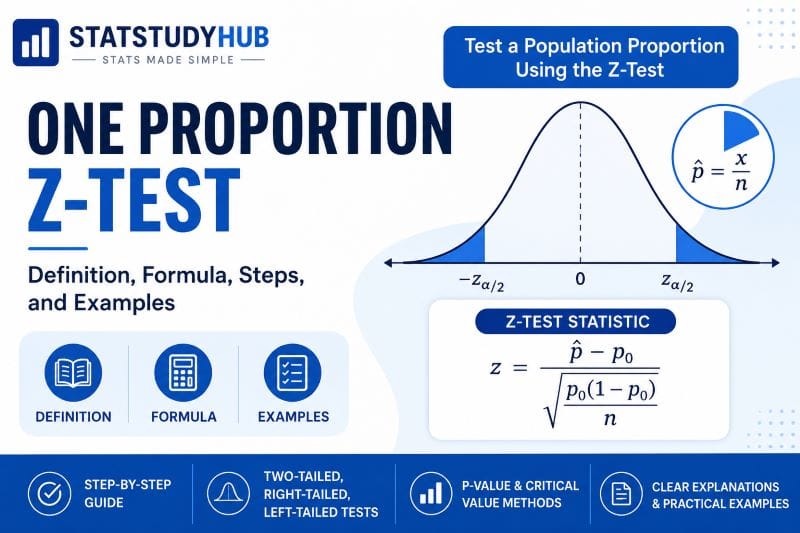
The one-proportion z-test formula is:
Where:
- p̂ is the sample proportion
- p0 is the hypothesized population proportion
- n is the sample size
The sample proportion formula is: p̂ = x/n
Where:
- x is the number of successes
- n is the sample size
NOTE. The standard error uses the hypothesized value (p0) and not the sample proportion, p̂. This is mainly because the test is calculated under the assumption that the null hypothesis is true.
Assumptions and Conditions
Before performing a one-proportion z test, the following assumptions must be satisfied:
- The data should be one sample drawn from a single population
- The response variable should have only two possible outcomes, such as Yes/No, Pass/Fail, Success/Failure, etc.
- Each observation should be independent of the others. In other words, one person’s response should not influence another person’s response.
- The normal approximation condition must be met. This assumption requires that the expected number of successes and failures be large enough. Specifically, both np0≥10 and n(1−p0)≥10 must be satisfied. If one or both values are less than 10, the z-test may not be reliable. In that case, an exact binomial test may be more appropriate.
How to Perform a One-Sample Proportion Z Test By Hand
To perform a one-sample proportion z test manually (by hand), follow these seven steps:
- State the hypothesis
- Choose the significance level
- Check the normal approximation condition
- Calculate the test statistic
- Find the p-value
- Make decision
- Write the Conclusion
Example 1. Two-Tailed Test
A company claims that 65% of customers prefer its new product design. A researcher surveys 150 customers and finds that 108 customers prefer the new design. At the 0.05 significance level, test whether the true population proportion is different from the company’s claim.
Solution
Step 1: State the Hypotheses
Since the question asks whether the population proportion is different from 0.65, this is a two-tailed test.
Thus, the hypotheses are:
H0: p = 0.65
H1: p ≠ 0.65
Step 2: Choose the Significance Level
From the question, the significance level, α = 0.05
Step 3: Check the Normal Approximation Condition
From the question, the sample size, n = 150, and hypothesized value, p0 = 0.65
Therefore:
- np0 = 150 (0.65) = 97.5
- n(1−p0) = 150 (1-0.65) = 52.5
Since both values are greater than 10, the normal approximation condition is met.
Step 4: Calculate the Test Statistic
By definition, the test statistic formula is:
From the question, x = 108 and n = 150. Thus, p̂ = 108/150 = 0.72
Substituting the values into the formula and solving, we have:
=
= 1.79743
Step 5: Find the P-Value
Using the z-score to p-value calculator, the p-value for z = 1.7974 is 0.0723.
Step 6: Make a Decision
Since the p-value (0.0723) is greater than the significance level (0.05), we fail to reject the null hypothesis.
Step 7: Write the Conclusion
At 5% significance level, there is not sufficient evidence to conclude that the population proportion of customers who prefer the new product design is different from 0.65.
Example 2. Right-Tailed Test
A school claims that 60% of its students pass a placement test. A teacher believes the true pass rate is greater than 60%. In a sample of 100 students, 68 students passed the test. At the 0.05 significance level, test whether the pass rate is greater than the school’s claim.
Solution
Step 1: State the Hypotheses
Since the question asks whether the population proportion is greater than 0.60, this is a right-tailed test.
Thus, the hypotheses are:
H0: p = 0.60
H1:p > 0.60
Step 2: Choose the Significance Level
From the question, the significance level is: α=0.05
Step 3: Check the Normal Approximation Condition
From the question, the sample size is n=100, and the hypothesized value is p0=0.60.
Therefore:
- np0=100(0.60)=60
- n(1−p0)=100(1−0.60)=40
Since both values are greater than 10, the normal approximation condition is met.
Step 4: Calculate the Test Statistic
By definition, the test statistic formula is:
Since n = 100 and x = 68, p̂ =68/100
= 0.68
Substituting the values into the formula and solving, we have:
=
=1.6330
Step 5: Find the P-Value
Using the p-value from z calculator, the right-tailed p-value for z =1.633 is 0.0512.
Step 6: Make a Decision
Since the p-value (0.0512) is greater than the significance level (0.05), we fail to reject the null hypothesis.
Step 7: Write the Conclusion
At 5% significance level, there is not sufficient evidence to conclude that the true pass rate is greater than 0.60.
Example 3. Left-Tailed Test
A factory claims that its defect rate is 10%. A quality control analyst believes the true defect rate is less than 10% after a new production process is introduced. In a sample of 200 products, 12 products are defective. At the 0.05 significance level, test whether the defect rate is less than the factory’s claim.
Solution
Step 1: State the Hypotheses
Since the question asks whether the population proportion is less than 0.10, this is a left-tailed test.
Thus, the hypotheses are:
H0: p = 0.10
H1: p < 0.10
Step 2: Choose the Significance Level
From the question, the significance level is: α=0.05
Step 3: Check the Normal Approximation Condition
From the question, the sample size is n=200, and the hypothesized value is p0=0.10.
Therefore:
np0=200(0.10)=20
n(1−p0)=200(1−0.10)=180
Since both values are greater than 10, the normal approximation condition is met.
Step 4: Calculate the Test Statistic
By definition, the test statistic formula is:
From the question, x =12 and n = 200. Thus: p̂ =12/200 = 0.06
Substituting the values into the formula and solving, we have:
=
= -1.8856
Step 5: Find the P-Value
Using our free z to p-value calculator, the left-tailed p-value for z = -1.8856 is 0.0297
Step 6: Make a Decision
Since the p-value (0.0297) is less than the significance level (0.05), we reject the null hypothesis.
Step 7: Write the Conclusion
At 5% significance level, there is sufficient evidence to conclude that the true defect rate is less than 0.10.
How to Find the P-Value or Critical Value Manually
In the examples above, you’ll realize that we used the p-value approach to make the final decision. Specifically, we used our online calculator to find the p-value and compared it with the significance level to determine whether to reject or fail to reject the null hypothesis.
However, in an exam or assignments, you might be required to either use the p-value or the critical value approach. Both of these methods should lead you to the same decision and conclusion, provided you do it correctly.
Below is a quick overview of how each of these methods works.
1) P-Value Method
In the p-value method, you first calculate the z statistic, then find the p-value that corresponds to that z value using z tables. However, the p-value will vary based on test type (two-tailed, right-tailed, or left-tailed test).
Here’s how to find the correct p-value from the z statistic for each test type:
- Left-tailed test – Find the area to the left of z using z tables.
- Right-tailed test – Find the area to the right of z using the z tables
- Two-tailed test – Find the area to the left of z using z tables and multiply by 2.
After finding the p-value, compare it with the significance level, α, and make the right decision as follows:
- If p≤α, reject the null hypothesis, H0. Otherwise, do not reject the null hypothesis.
Want to learn the manual process of finding the p-value from a z-statistic? Read our complete guide on how to find the p-value from z. You can also use our p-value from z calculator to quickly find the p-value for left-tailed, right-tailed, and two-tailed z tests.
2) Critical Value Method
In the critical value method, you compare the calculated z statistic with the critical z value.
The critical value depends on:
- the significance level, α
- whether the test is left-tailed, right-tailed, or two-tailed
The decision rule in this case is:
- Reject the null hypothesis (H0) if the absolute z-statistic value is greater than the absolute z-critical value. Otherwise, do not reject H0.
For example, at α=0.05, the corresponding z critical values for each test are:
- Left-tailed test: Z-crit = -1.645
- Right-tailed test: Z-crit = 1.645
- Two-tailed test: Z-crit = ±1.96
So, for a two-tailed test at the 5% significance level, you reject the null hypothesis if the absolute value of the z statistic is greater than the absolute z-critical value (1.96).
Which Method Should You Use?
Use the method your instructor requests. If no method is specified, the p-value method is often easier because it gives a direct comparison with α.
The critical value method is also useful because it shows the rejection region clearly. This is especially helpful when drawing a normal curve or solving hypothesis test questions by hand.
To save time, you can use our z critical value calculator to find the correct critical value. However, if you want to understand the process manually, read our guide on how to find z critical values by hand.
One Proportion Z-Test vs Exact Binomial Test
A one-proportion z-test and an exact binomial test can both be used to test a claim about one population proportion.
The difference is how they calculate the result.
| Test | Best Used When |
|---|---|
| One proportion z-test | The sample size is large enough for the normal approximation. |
| Exact binomial test | The sample size is small or expected successes/failures are too low. |
The one-proportion z-test uses the normal distribution as an approximation. This works well when: np0≥10 and n(1−p0)≥10
However, if these conditions are not met, the exact binomial test is usually a better choice.
Frequently Asked Questions
It is a hypothesis test used to compare one sample proportion with a hypothesized population proportion.
The test is appropriate when you have one sample, a binary outcome, and you want to test whether the population proportion differs from a hypothesized value.
The formula is z = (p̂-p0)/√[p0(1-p0)/n] where p̂ is the sample proportion, p0 is the hypothesized population proportion, and n is the sample size.
In a one-sample proportion test, p0 is the hypothesized population proportion. Simply stated, it is the value stated in the null hypothesis.
The normal approximation condition is: np0≥10 and n(1−p0)≥10. If these conditions are not met, an exact binomial test may be more appropriate.