This calculator converts any percentile into its corresponding z-score using the standard normal distribution. Simply enter the percentile (between 0 and 100), select the type of test, and click the “Calculate” button.
The calculator will instantly return the correct z-score value. It also provides you with a clear, step-by-step explanation showing you how to convert a percentile to a z-score value, manually.
How to Use the Percentile to Z Score Calculator
Finding the z score corresponding to a certain percentile using our calculator is easy. You only need to follow these simple steps:
- Enter the percentile value (between 0 and 100) into the input box.
- Select the correct test type based on your goal:
- If you want to find a critical value for a confidence level or a non-directional hypothesis test, you should select the two-tailed test
- However, if you want to find a z-value to solve cut-off score problems, use the default one-tailed test.
- Click the “Calculate” button
The calculator will instantly return the correct z-score value, along with a clear, step-by-step explanation showing you how to find the z value from a percentile.
What is a Percentile?
In statistics, a percentile is a measure that indicates the relative standing of a value within a dataset. It tells us the percentage of observations that fall at or below a particular value.
For example, if a score is at the 90th percentile, it means that 90% of the data lies below that value, and only 10% lies above it. In hypothesis testing and confidence interval calculations, percentiles are used to determine critical z values. In this case, a central percentile (such as 90% or 95%) represents the confidence level in a two-tailed test.
What is a Z Score?
A z score, also known as a standard score, is a statistical measure that tells you how many standard deviations a value is above or below the mean of a distribution.
The formula for a z score is z=(x−μ)/σ
Where x is the raw value, μ is the population mean, and σ is the population standard deviation.
After converting a raw score into a z score, the value follows a standard normal distribution, which has a mean of 0 and a standard deviation of 1.
Note. Each z score corresponds to a cumulative probability, representing the area under the normal curve to the left of that value.
Want a more detailed explanation of the z-score with examples? See our complete z-score guide.
Examples: Finding Z-score From Percentile Using the Calculator
Example 1. Finding a Cut-Off Score (One-Tailed)
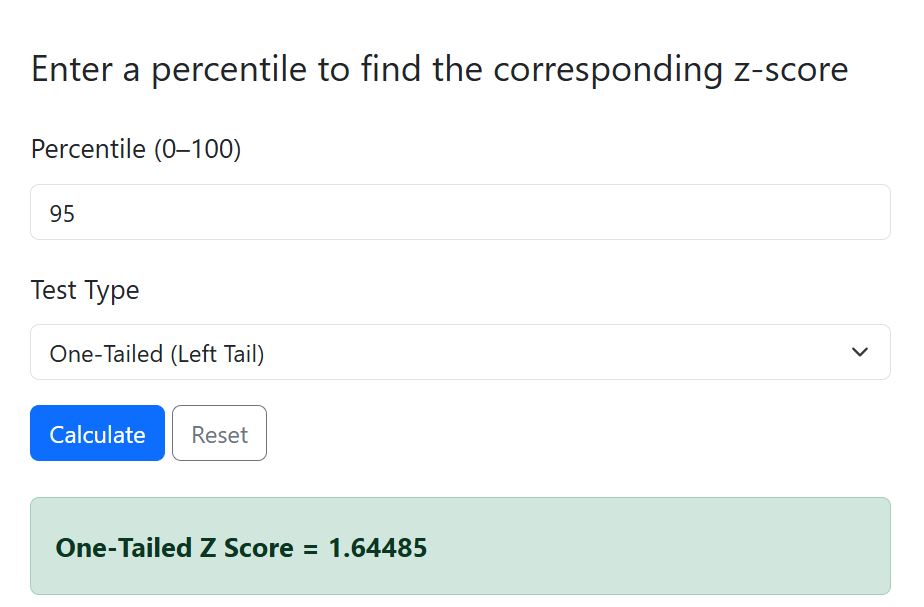
Suppose you’re analyzing exam scores that follow a normal distribution. You want to determine the score that separates the top 5% of students from the rest.
To find the z-score using the calculator:
- Enter 95 in the percentile input field (because 95% of students score below the top 5%)
- Select one-tailed (left) as the test Type
- Click Calculate.
The z-score will be 1.64485. This means the cut-off score is 1.645 standard deviations above the mean.
Now, suppose that the exam has a mean of 80 and a standard deviation of 10. In this case, you can use the z-score value to find the cut-off score.
In this case, the Cut-off score formula is:
Cut-off score =Mean+(Z-score×SD)
=80 + (1.645×10)
=96.45
Therefore, students scoring 96.45 or higher fall within the top 5% of test-takers.
Example 2. Determining a Two-Tailed Critical Z Value
Suppose you are conducting a study and want the z critical value for a 99% confidence interval. You can still use the percentile to z-score calculator. However, you don’t need to convert confidence level to significance level (α).
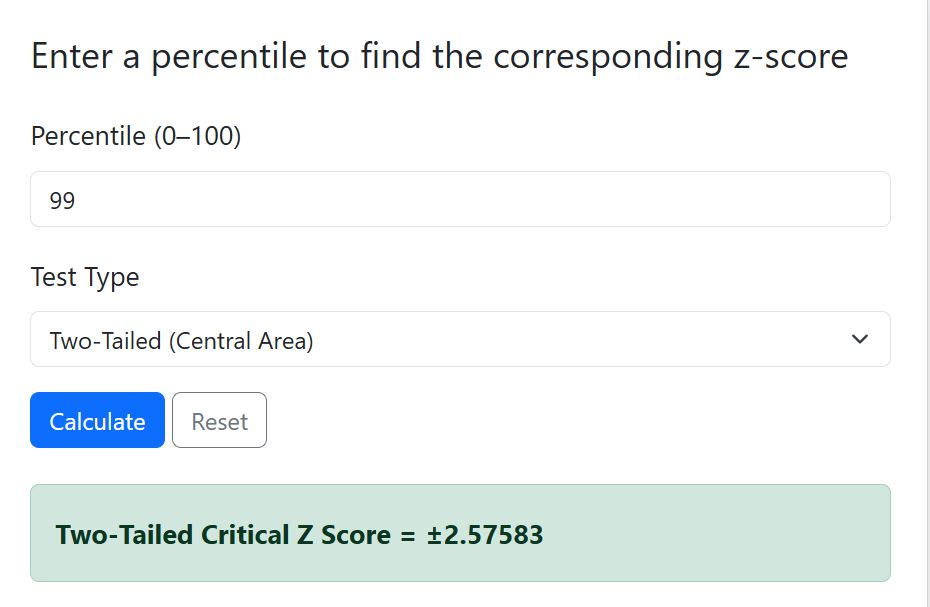
Here’s how you can use the calculator to find the critical z value corresponding to 99% confidence level.
- Enter 99 in the percentile input field
- Select two-tailed (Central Area) as test type
- Click Calculate
The calculator returns the corresponding two-tailed critical z value for 99% confidence level as ±2.576. This means the 99% confidence interval includes all values within 2.576 standard deviations above and below the mean.
Now, suppose you want to find the 99% confidence interval for a dataset with a mean of 50 and a standard deviation of 5.
You can easily calculate the interval as follows:
Lower bound =50 − (2.576×5)
=50−12.88
=37.12
Upper bound = 50+(2.576×5)
=50+12.88
=62.88
Thus, 99% of the data is expected to lie between 37.12 and 62.88.
Want a tool that specifically compute left, right, and two-tailed critical values for z? Use the critical z value calculator instead.