This sample mean calculator computes the average of a dataset based on sample observations. It also provides a clear, step-by-step explanation showing you exactly how the sample mean was computed.
Find the sample mean calculator
DescriptiveEnter numbers separated by commas, spaces, or tabs, or paste values directly from Excel to calculate the sample mean (x̄).
How to Use the Sample Mean Calculator
This calculator allows you to quickly find the mean of your sample data with a click of a button. To calculate the sample mean, follow these steps:
- Step 1: Enter the sample data in the input field. It accepts comma-separated, space-separated, or even copy-paste from Excel.
- Step 2: Click the “Calculate” button
The calculator will instantly return the sample mean. You can also expand the step-by-step explanation section to see how the mean was computed for your sample data.
What is a Sample Mean?
The sample mean is the average of a set of observations taken from the population. In statistics, the sample mean symbol is x-bar (x̄).
The sample mean formula is x̄ = Σxi / n
Where:
- x̄ is the sample mean
- Σxi is the sum of all values in the sample data
- n is the total number of observations in the sample data
How to Find the Sample Mean (with Example)
To find the sample mean of any given data, follow these steps:
- Step 1: Sum all the values in the sample data to get Σxi.
- Step 2: Count the number of observations in the dataset to get n.
- Step 3: Apply the sample mean formula. This involves dividing the sum of all values (Σxi) by the total number of observations (n)
Example 1. A lecturer wants to estimate the average time students spend studying for a statistics exam. Instead of surveying the entire class, she randomly selects 8 students and records the number of hours they studied in the week before the exam.
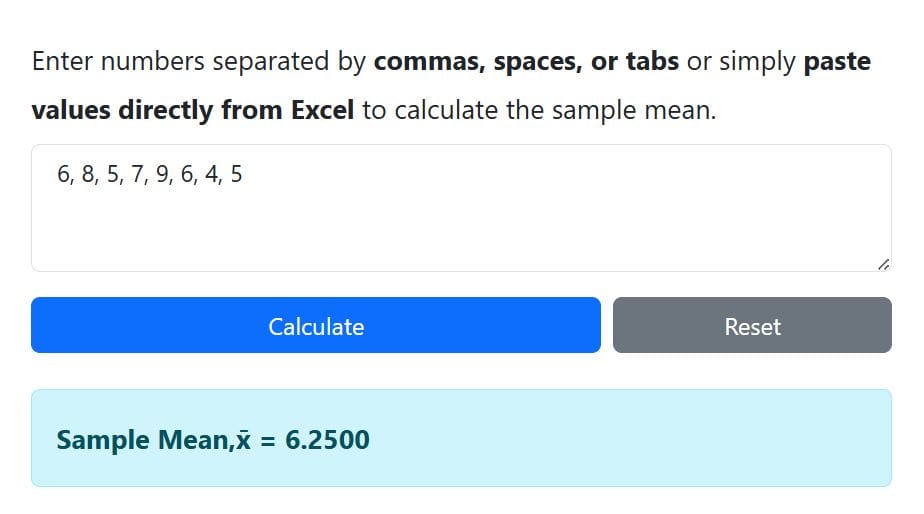
Hours: 6, 8, 5, 7, 9, 6, 4, 5
Calculate the sample mean study time.
Solution
To find the sample mean of the number of hours spent studying, follow these steps:
Step 1: Sum all the values in the sample data
6 + 8 + 5 + 7 + 9 + 6 + 4 + 5 = 50
Thus, Σxi = 50
Step 2: Count the number of observations in the sample data
From the sample data, there are 8 observations. Thus, n = 8
Step 3: Divide the sum of all values by the total number of observations in the sample data
The sample mean, x̄ = 50/8
= 6.25.
Alternatively, you can easily find the sample mean using the calculator. Simply copy and paste the data into the calculator’s input field and click “Calculate.”
The calculator returns the sample mean as 6.25, as shown below:
Related: How to Find the Sample Mean in Excel
Population Mean vs Sample Mean
While the steps for calculating the sample mean and the population mean are the same, there’s a slight difference. The table below shows the key differences
| Sample Mean | Population Mean |
|---|---|
| The sample mean symbol is x-bar (x̄) | The population mean symbol is mu (μ) |
| The sample mean formula is x̄ = Σxi / n. In other words, to find the sample mean, you sum all the sample values and divide by the sample size (𝑛) | The population mean formula is μ = ΣX / N. In other words, you need to sum all values and divide by the total population size (𝑁). |
| The sample mean is a variable value that changes from sample to sample (a statistic). | The population mean is a fixed, constant value (a parameter) for a given population. |
| The sample mean is used to estimate the unknown population mean. In this case, larger, random samples provide better estimates. | The population mean is often unknown and difficult or impossible to calculate for large populations. |
Frequently Asked Questions
The sample mean is the average value calculated from a subset of observations drawn from a larger population. It provides an estimate of the population mean and is one of the most commonly used measures of central tendency in statistics.
To calculate the sample mean:
1) Add all values in the sample dataset.
2) Count the total number of observations.
3) Divide the total sum by the number of observations.
This calculator performs these steps automatically and returns the average instantly.
The sample mean measures the average of a subset of observations drawn from the population. On the other hand, the population mean represents the average of all observations in the entire population.
Yes. The sample mean depends on the values in the dataset. If you add new observations or remove some observations, the mean will change because the total sum and sample size will change.