This calculator finds the sample standard deviation once you enter the sample data values. Simply enter the sample data points separated by commas, spaces, line breaks, or copy-paste from Excel and hit the “Calculate” button.
The calculator instantly returns the sample standard deviation, along with a clear step-by-step solution.
Free Sample Standard Deviation Calculator
DescriptiveEnter your sample data separated by commas, spaces, or tabs (you can paste directly from Excel). This calculator computes the sample standard deviation (s).
Want a tool that helps you calculate the sample and population standard deviation in one place? Use the standard deviation calculator.
How to Use the Sample Standard Deviation Calculator
Need a quick way to calculate the sample standard deviation? Follow these simple steps for instant results:
- Step 1. Enter sample data values (they can be separated by space, comma, or copy-paste from Excel)
- Step 2. Click the “Calculate” button
The calculator will instantly return the accurate results, with a clear step-by-step explanation. Specifically, the explanation shows you exactly how you can find the sample standard deviation by hand.
Want to calculate the population standard deviation instead? Use the population standard deviation calculator now.
What is the Sample Standard Deviation?
The sample standard deviation is a measure of dispersion that quantifies how spread out the sample data is from the sample mean. A small sample standard deviation indicates that the data points are clustered closely around the mean. On the other hand, a large value means that the data is more widely spread.
Sample Standard Deviation Formula
The sample standard deviation formula is:
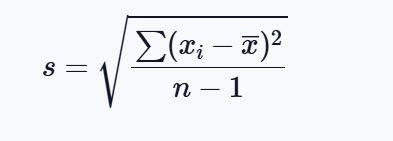
Where:
- s is the sample standard deviation
- xi represents each individual data value
- x̄ is the sample mean
- n is the number of observations in the sample
- ∑(xi−x̄)2 represents the sum of all squared deviations
Note. Because a sample does not perfectly represent the full population, the formula is slightly different from the population standard deviation formula. Specifically, instead of dividing by the sum of squared deviations by n, we divide by n − 1. This adjustment is called Bessel’s correction. It helps reduce bias when estimating the true population variability, hence yielding a more accurate estimate.
Sample vs. Population Standard Deviation
When working with data, one of the most common questions is: Should I use the sample standard deviation or the population standard deviation? The answer depends on the type of data you have.
Here’s how to choose between population vs. sample standard deviation:
- Use population standard deviation if the data is from the entire set of individuals you’re interested in (population)
- Use the sample standard deviation when you’re working with a subset (a sample) drawn from the target population. In most real-world problems, you’ll find yourself working with sample data, hence the sample standard deviation.
The table below shows a summary of the key differences between the sample and population standard deviation.
| Feature | Sample Standard Deviation | Population Standard Deviation |
|---|---|---|
| Symbol | s | σ |
| Denominator | n − 1 | n |
| Used When | Data is a sample from a larger population | Data includes the entire population |
| Purpose | Estimates population variability | Measures actual population variability |
| Excel Formula | STDEV.S () | STDEV.P () |