This calculator computes both the population standard deviation (σ) and the sample standard deviation (s) instantly – all in one place. In addition to the final standard deviation value, it also calculates related statistics such as:
- The mean
- The variance
- The sum of all values
- The sum of squared deviations
- The number of observations
Simply enter your data values, choose whether you are working with a sample or a population, and click the “Calculate” button.
What makes this calculator different from most online tools is that it not only gives you the answer but also shows you how to compute the standard deviation by hand, step-by-step.
Standard Deviation Calculator
DescriptiveEnter your data separated by commas, spaces, tabs, or paste directly from Excel. Then choose whether to compute the population or sample standard deviation.
Do you know the kind of data you’re working with and need a custom calculator for that? Use our custom standard deviation calculators linked below.
How to Use the Standard Deviation Calculator
Calculating the population and sample standard deviation using this tool is very simple. Just follow these steps:
- Enter the raw data and separate it either with commas, spaces, or tabs. You can also copy-paste from Excel.
- Select the type of standard deviation you wish to calculate (whether the sample standard deviation or the population standard deviation).
- Click the “Calculate” button.
If you select the sample standard deviation, you’ll instantly get the sample standard deviation along with other essential statistics, including:
- Sample Mean, x̄
- Sample Variance, s²
- Sum of Squared Deviations, ∑(xᵢ − x̄)²
- Number of Observations in the Sample data, n
- Sum of All Values, ∑xᵢ
However, if you select the population standard deviation, the calculator will instantly compute the population standard deviation (σ), along with other essential statistics such as:
- Population Mean, μ
- Population Variance, σ²
- Sum of Squared Deviations, ∑(xᵢ − μ)²
- Total Number of Values in the population data, N
- Sum of All Values, ∑xᵢ
Note. Each of the calculators you select also provides a step-by-step solution, explaining how you’d compute standard deviation by hand.
What is Standard Deviation?
Standard deviation is one of the statistical measures of dispersion that tells you how spread out your data is from the average (mean). In simple terms, it shows whether your data is tightly clustered around the mean or widely scattered. A small standard deviation means your values are close together, while a larger one means there is more variability in your dataset.
There are two types of standard deviations:
- Population standard deviation, which tells you how spread out the population data is from the population mean.
- The sample standard deviation, which informs you how spread out the sample data is from the sample mean.
Standard Deviation Formula
The formula for calculating the standard deviation varies depending on whether you’re working with population or sample data.
For instance, if you’re working with data from the entire group under study (population), you should use the population standard deviation formula. The formula is:
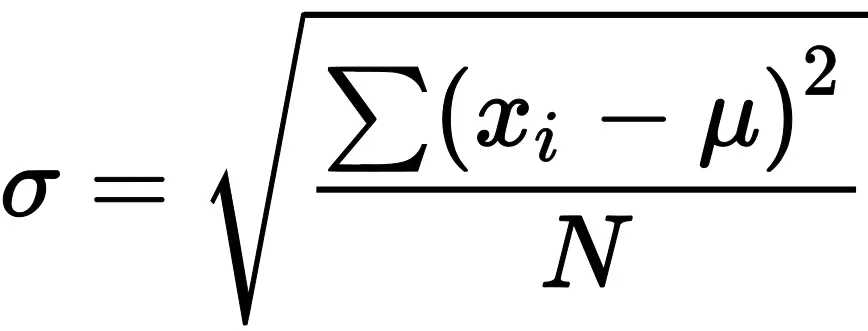
Where:
- σ is the population standard deviation symbol
- N is the total number of observations in the population data
- μ is the population mean
- ∑(xᵢ − μ)² is the sum of squared deviations from the population mean
However, if you’re working on data from a sample (a subset of the population), you should use the sample standard deviation formula. The formula is:
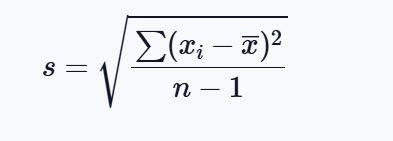
Where:
- s is the sample standard deviation symbol
- n is the total number of observations in the sample data
- x̄ is the sample mean
- ∑(xᵢ − x̄)² is the sum of squared deviations from the sample mean
How to Calculate Population Standard Deviation (σ)
Still struggling with finding the population standard deviation by hand? Follow these steps:
- Find the population mean (μ)
- Subtract the population mean (μ) from each value and square the result
- Sum all the squared deviations
- Divide the Sum of Squared Deviations by n−1
- Take the Square Root of the Result
Example 1. Finding Population Standard Deviation by Hand
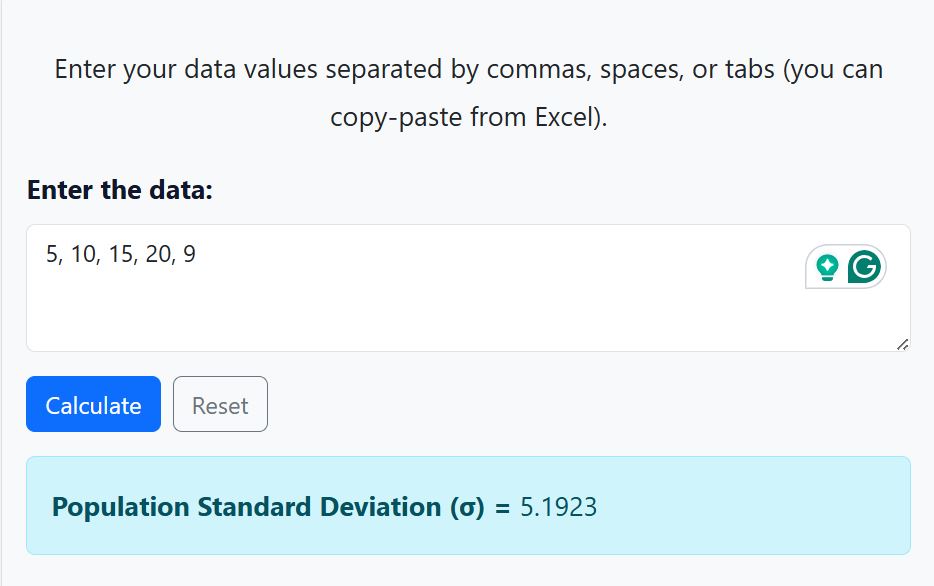
Calculate the standard deviation for the following population data
Dataset. 5, 10, 15, 20, 9
Solution
Step 1. Calculate the Population Mean
The population mean formula is μ=∑xi/N
Where:
- N is the total number of observations
- ∑xi is the sum of all observations
From our dataset:
∑xi = 5 + 10 + 15 + 20 + 9
= 59
Also, N = 5 since there are only 5 observations in the data
Thus, the population mean, μ = 59/5
=11.8
Step 2. Subtract the population mean (μ) from each value and square the result
We need to subtract the population mean (11.8) from each value, and square the results
The table below shows how to compute deviations from the population mean and the squared deviations.
Note. We substituted μ with 11.8
| xi | xi−11.8 | (xi−11.8)2 |
|---|---|---|
| 5 | 5-11.8 = -6.8 | (-6.8)2 = 46.24 |
| 10 | 10-11.8 = -1.8 | (-1.8)2 = 3.24 |
| 15 | 15-11.8 = 3.2 | (3.2)2 = 10.24 |
| 20 | 20-11.8 = 8.2 | (8.2)2 = 67.24 |
| 9 | 9-11.8 = -2.8 | (-2.8)2 = 7.84 |
Step 3. Sum all the squared deviations
The sum of squared deviation formula is: ∑(xi−μ)2
To find the sum of the squared deviations, we need to sum the values in the column, (xi−11.8)2
Thus, ∑(xi−μ)2 = 46.24 + 3.24 + 10.24 + 67.24 +7.84
= 134.8
Step 4. Divide the sum of squared deviations by N
Dividing the sum of squared deviations by N gives you the population variance, σ2
Therefore, σ2 = ∑(xi−μ)2/N
= 134.8/5
= 26.96
Step 5. Find the Population Standard Deviation
The population standard deviation is the square root of the population variance.
Thus, σ=√(26.96)
= 5.1923
Therefore, the population standard deviation of the data is approximately 5.1923.
Alternatively, if you only need quick solutions, just copy-paste the values in the calculator and click the “calculate” button. The calculator will yield similar results, as shown below.
How to Calculate the Sample Standard Deviation (s)
Calculating the sample standard deviation manually is easy once you understand the formula. Here are the main steps you should follow:
- Find the Sample Mean
- Subtract the Sample Mean From Each Value and Square the Result
- Sum All the Squared Deviations
- Divide the Sum of Squared Deviations by n−1
- Take the Square Root of the Result
Example 2. Finding the Sample Standard Deviation by Hand
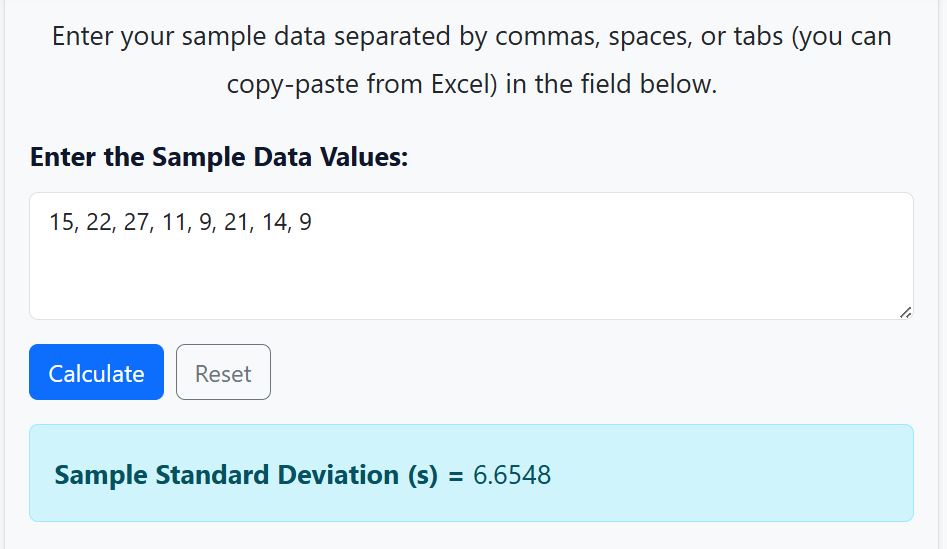
Calculate the Sample Standard Deviation of the following sample data
Dataset: 15, 22, 27, 11, 9, 21, 14, 9
Solution
Step 1. Find the Sample mean
By definition, the sample mean formula is x̄ = ∑xi/n
= (15 + 22 + 27 + 11 + 9 + 21 + 14 + 9)/8
=128/8
= 16
Step 2. Subtract the Sample Mean From Each Value and Square the Result
The results will give us (xi−x̄)2
The table below shows how to subtract and square each deviation
| xi | xi – 16 | ( xi – 16)2 |
|---|---|---|
| 15 | 15-16 = -1 | (-1)2 = 1 |
| 22 | 22-16 = 6 | (6)2 = 36 |
| 27 | 27-16 = 11 | (11)2 = 121 |
| 11 | 11-16 = -5 | (-5)2 = 25 |
| 9 | 9-16 = -7 | (-7)2 = 49 |
| 21 | 21-16 = 5 | (5)2 = 25 |
| 14 | 14-16 = -2 | (-2)2 = 4 |
| 9 | 9-16 = -7 | (-7)2 = 49 |
Step 3. Sum all the Squared Deviations
We need to find the sum of all values in the column, ( xi – 16)2. This will give us the numerator of the sample standard deviation formula, ∑(xi−x̄)2
Thus, ∑(xi−x̄)2 = 1 + 36 + 121 + 25 + 49 + 25 + 4 + 49
=310
Step 4. Divide the sum of squared deviations by n-1
There are 8 observations in the sample data. Thus, n = 8.
Therefore, n-1 = 8-1
= 7
Dividing the sum of squared deviations by n-1 gives: 310/7
=44.2857.
This variance is the sample variance
Step 5. Take the Square root of the results
The sample standard deviation is the square root of its variance.
Thus, the sample standard deviation, s = √(44.2857)
=6.6548
Using our sample standard deviation calculator, we get similar results, as shown below.
When to Use Population vs Sample Standard Deviation
Unsure whether to use population or sample standard deviation? Don’t worry! The choice depends on the type of data you’re working with. Here’s a quick summary to help you choose the right method:
- Use the population standard deviation if the data you’re working with includes every member in the group you’re studying.
- Use the sample standard deviation if the data you’re working with is a subset (sample) drawn from a larger group (population).
Want a quick overview of their differences? The following table shows a summary of the key differences between their formulas and use cases.
| Type | Formula | Use Case |
|---|---|---|
| Population | σ = √(Σ(x − μ)² / N) | Entire population |
| Sample | s = √(Σ(x − x̄)² / (n − 1)) | Subset of population |
Note. From the table, you’ll note that the key difference is in their formula. For population data, the sum of squared deviations is divided by N, whereas that of the sample is divided by n-1. The n-1 adjustment is known as Bessel’s correction and helps you get a more accurate estimate of the true population variability even when working with sample data.
Frequently Asked Questions
Standard deviation is a measure of how spread out the data values are from the mean. A small standard deviation means the values are close to the mean, while a large standard deviation indicates greater variability in the data.
The sample standard deviation (s) is used when your data represents a subset of a larger population. In this case, you should divide the sum of squared deviations by n − 1. However, the population standard deviation (σ) is used when your data includes every member of the population. The sum of squared deviations should be divided by N.
The formula depends on whether you are calculating a sample or population standard deviation.
– For population standard deviation, the formula is, σ =√[∑(xi−μ)2/N]. Where μ is the population mean, N is the total number of observations in the population, and ∑(xi−μ)2 is the sum of squared deviations from the population mean.
– For sample standard deviation, the formula is, s = √[∑(xi−x̄)2/(n-1)]. Where n is the number of observations in the sample data, x̄ is the sample mean, and ∑(xi−x̄)2 is the sum of squared deviations from the sample mean.