This p-value from r calculator computes one-tailed and two-tailed p-values from Pearson’s correlation r coefficient. Simply enter the correlation coefficient (r) and the sample size (n) to get instant results, with a clear step-by-step explanation of how the p-values were computed.
P-Value from Pearson’s r Calculator
pvalueEnter your Pearson correlation coefficient (r) and sample size (n) to calculate the one-tailed and two-tailed p-values.
Want to use the critical value approach to determine whether the correlation value is statistically significant? Use the correlation critical value calculator instead.
How to Use the P-value From r Calculator
Finding the p-value from a Pearson’s correlation coefficient (r) is simple with this tool. Just follow these simple steps:
- Enter Pearson’s correlation coefficient (r). It can either be negative or positive
- Enter the sample size (n)
- Click Calculate
The calculator will instantly return the one-sided and two-sided p-values, along with other essential statistics such as the t-statistic and degrees of freedom (df). You can also expand the step-by-step explanation section to learn how the p-value was computed.
Example: Find P-Value from r using the Calculator
To learn how to find the p-value from the pearson’s correlation coefficient, consider the following example.
Suppose a researcher computes the Pearson correlation coefficient between two variables and obtains:
- r = 0.45
- sample size (n) = 30
Find the correct p-value for the test.
Solution
To find the p-value using the calculator:
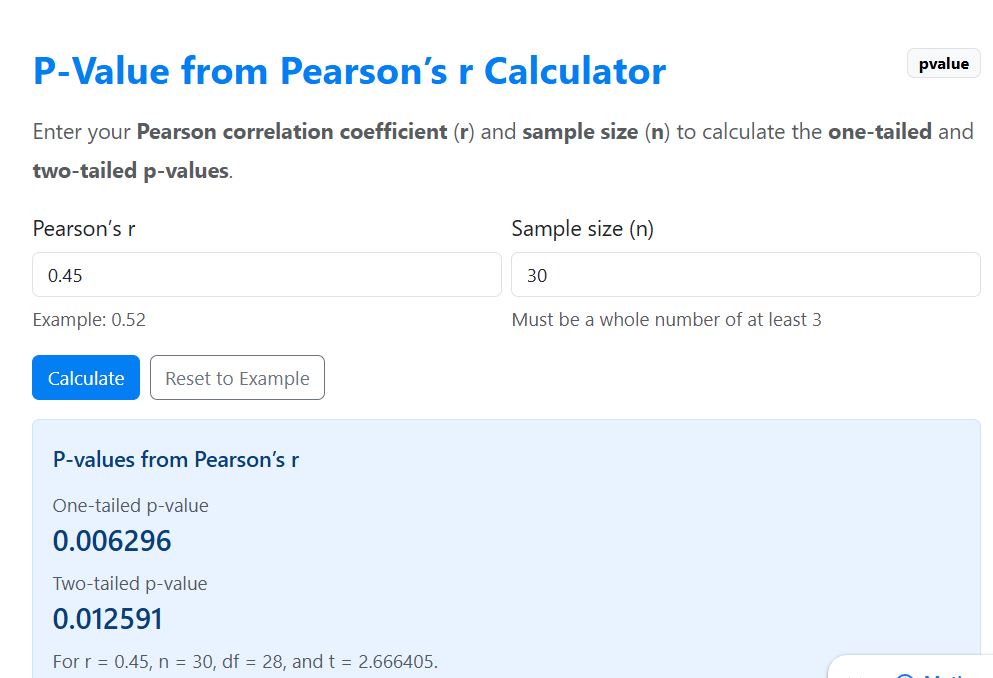
- Enter 0.45 as the correlation coefficient (r).
- Enter 30 as the sample size (n).
- Click Calculate.
The calculator instantly returns:
- one-tailed p-value = 0.006296
- two-tailed p-value = 0.012591
If the test is two-tailed, here’s how you can make the decision.
Decision: Since the p-value (0.0125) is less than the 0.05 significance level, we reject the null hypothesis and conclude that the correlation is statistically significant.
Recall. You can also expand the step-by-step explanation section to understand how the p-values were computed.
How to Find the P-value From r
After computing the Pearson’s correlation coefficient (r), you may need to compute the p-value to help you decide whether to reject or fail to reject the null hypothesis (H0). If using software, this is straightforward. However, if you’re in an exam or doing an assignment, you need to understand how to find the p-value from Pearson’s correlation (r), manually.
Here’s how you can do that:
Step 1. Convert the correlation coefficient to a t statistic
To convert r to a t statistic, we use the formula:
Where:
- r = Pearson’s correlation coefficient
- n = sample size
Step 2. Use a t-distribution to find the appropriate p-value
After computing the t statistic in Step 1, you can quickly find the p-value using a t-distribution table.
But before that:
- Compute the degrees of freedom using the formula df=n−2
- Locate the row corresponding to the degrees of freedom in the t table.
- Compare the absolute value of the calculated t statistic with the critical values in the table.
For a one-tailed p-value, we look for P(T>∣t∣)
This represents the probability that the t statistic is greater than the observed value in one direction of the distribution.
Steps:
- Find the row corresponding to the degrees of freedom (df = n − 2).
- Move across the row until you locate the t value closest to your computed t statistic.
- The probability at the top of that column gives the one-tailed p-value.
For a two-tailed test, the p-value accounts for both tails of the distribution. Thus, it uses the formula: p = 2 * P(T>∣t∣). In other words, to find the p-value for a two-tailed test, you only need to multiply the one-tailed p-value by 2.
When to Use This Calculator
The P-value from the r calculator is used when you want to determine whether a Pearson correlation coefficient is statistically significant. In other words, it helps you assess whether the relationship observed between two variables is likely to be real or could have occurred by chance.
You may need to use this calculator in situations such as:
- Testing whether two variables are linearly related. For example, examining whether study time is associated with exam performance.
- Checking the statistical significance of a correlation coefficient. After computing Pearson’s r, the p-value tells you whether the correlation is statistically meaningful.
- Determining whether an observed correlation could occur by chance. A small p-value indicates that the observed relationship is unlikely to be due to random variation in the data.
Frequently Asked Questions
The p-value from Pearson’s correlation coefficient measures the probability of observing a correlation as strong as the one obtained if the true correlation between the variables is zero. A small p-value indicates that the observed relationship is unlikely to have occurred by chance.
The degrees of freedom for testing the statistical significance of a Pearson correlation coefficient are: df = n-2. In this case, n is the sample size.
In Pearson’s correlation:
– A one-tailed p-value tests whether the correlation exists in a specific direction (positive or negative).
– A two-tailed p-value tests whether a correlation exists in either direction.
Note. Most studies use two-tailed tests unless there is a strong theoretical reason to test a specific direction.
Yes. A correlation coefficient can be statistically significant even if its magnitude is small. This is very common when the sample size is large, as Larger samples provide more statistical power to detect smaller relationships.
You should use this calculator after computing Pearson’s correlation coefficient (r), and you want to quickly find the p-value for the test. The calculator instantly returns one-tailed and two-tailed p-values, given the correlation coefficient (r) and the sample size (n).